What is a click test and why should it be part of your UX toolkit?

Whether it’s evaluating a current website, testing a prototype, or iterating throughout the product development cycle, click tests are a simple way to test your designs.
If you’re new to the world of clickmaps, heatmaps and darkmaps, let’s explore click testing and how it can benefit your product development.
What is a click test?
Click tests are a quick and simple way to test and validate wireframes, prototypes, websites, apps, and mobile webpages.
The test presents participants with a static image or screenshot of a page from the site or app, before asking questions such as, “Where would you click to navigate to another page?" By asking users to carry out specific tasks, click tests allow you to isolate and investigate user behavior.
Marketing insights
Discover how UserTesting helps marketers refine messaging, optimize campaigns, and drive stronger customer connections.
The places on the screen where a user ‘clicks’ are recorded for post-test analysis. The first place users select is considered the most common measurement, and is often referred to as first-click testing. The results generated can take the visual form of a heatmap (see image below) or click-map or dark-map.
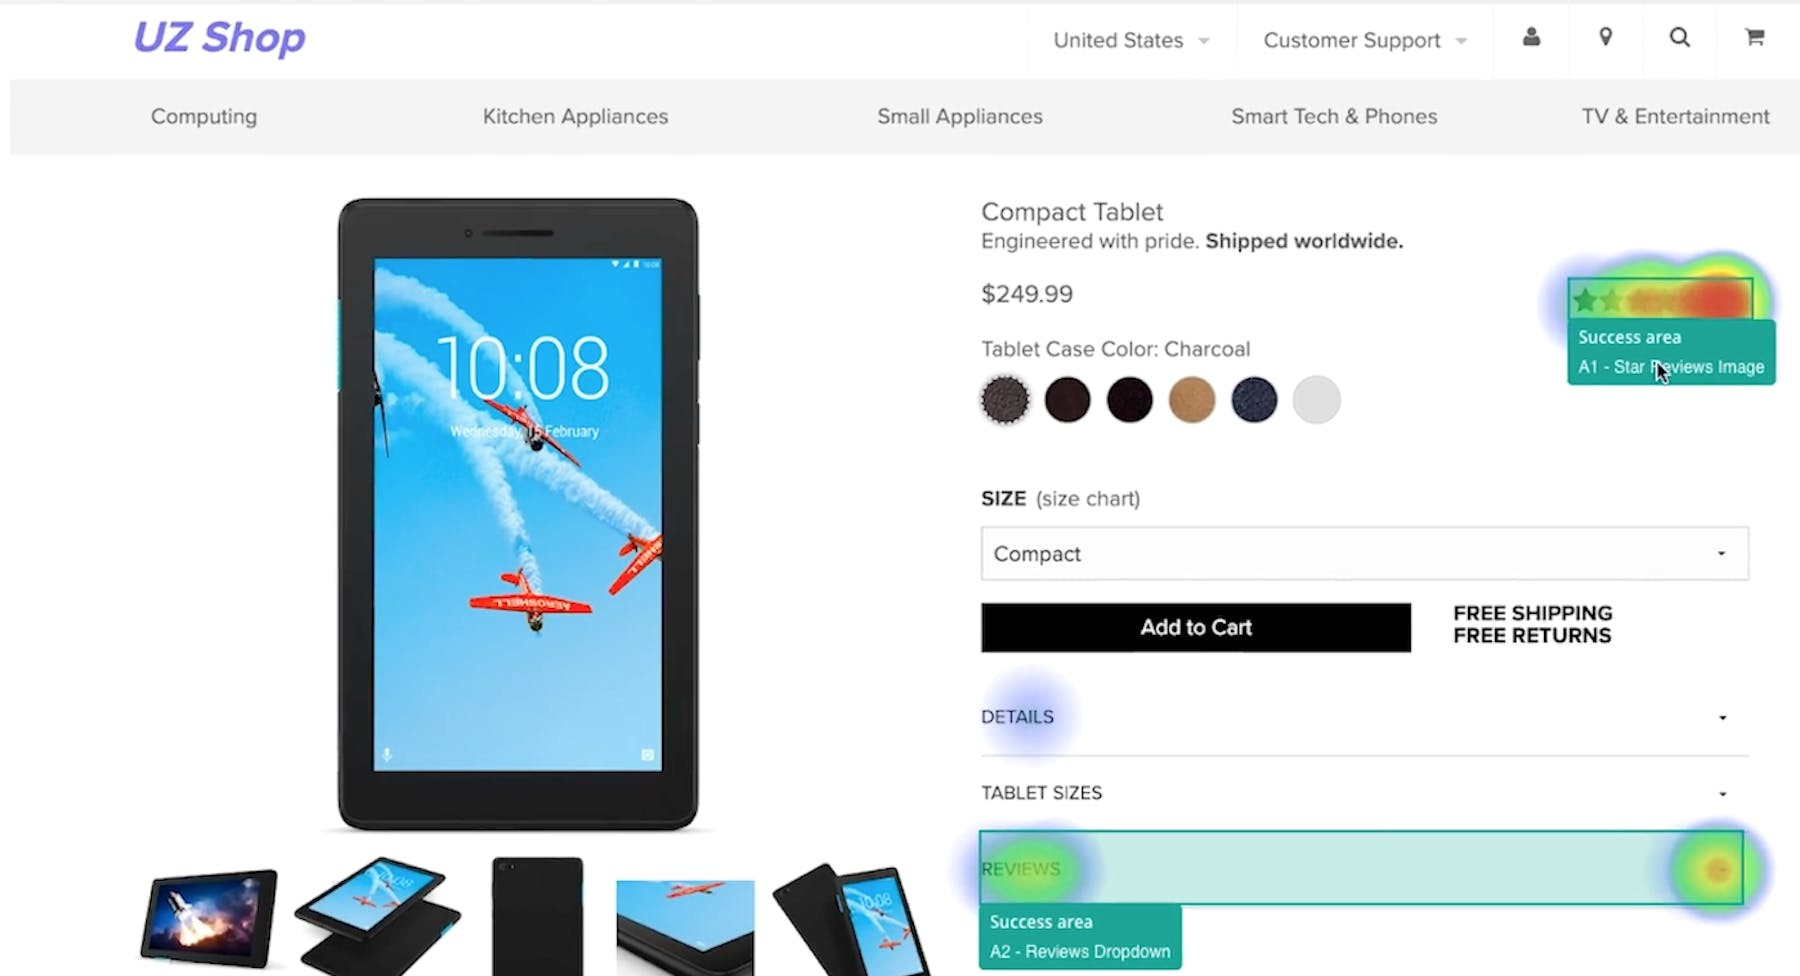
Click tests can be done on everything from high-res images to scanned doodles on a bar napkin.
Why do you need to conduct a click test?
Click testing has a whole variety of use cases. You can find out how your visitors behave on a webpage from their very first click, by asking them specific questions about their behavior, comprehension and/or preference.
Behavioral questions include:
- Where would you expect to click to find the information you’re looking for?
- Where would you click to navigate to another specific page?
- Where would you click to progress to the next step in a customer journey (for example, through the checkout process)?
- How would you access a specific piece of content?
Comprehension questions might include:
- What does this icon mean?
- What is unclear?
- What is clear?
- What helps you make a decision?
Preference questions might include:
- Click on what you like
- Click on what you don’t like
- Click on your top three elements
- What needs to change?
By answering these types of questions, your visitors can help improve the usability of a website. Click testing can show you how users actually interact with a design which reveals user expectations or areas of confusion within the experience.
The results generated by click tests, often in the form of a heatmap, can also help define what parts of your website grab the most attention. This leads to inspiration when improving the visual hierarchy of a website's elements.
What are the benefits of click testing?
A great benefit of click testing is that you don’t even need to have a website up and running to verify your ideas. Along with live sites, you can also test prototypes and wireframes. Even rough paper sketches will do – negating the need for a high-resolution screenshot and resulting in valuable user feedback early in the design phase.
Click testing is great for making better, more informed design decisions when developing a new page or product. This includes carrying out click tests on multiple design variants to understand which one best meets the key objectives of that design. It’s like A/B testing but without the cost of development work or the risk of launching a poor design.
This makes click testing a great exercise for trying out more experimental designs.
When should you run a click test?
Click testing is an ideal method to evaluate and iterate concepts with users at an early stage, allowing research and design to run concurrently, saving both time and money throughout the product lifecycle.
What results do you get from a click test?
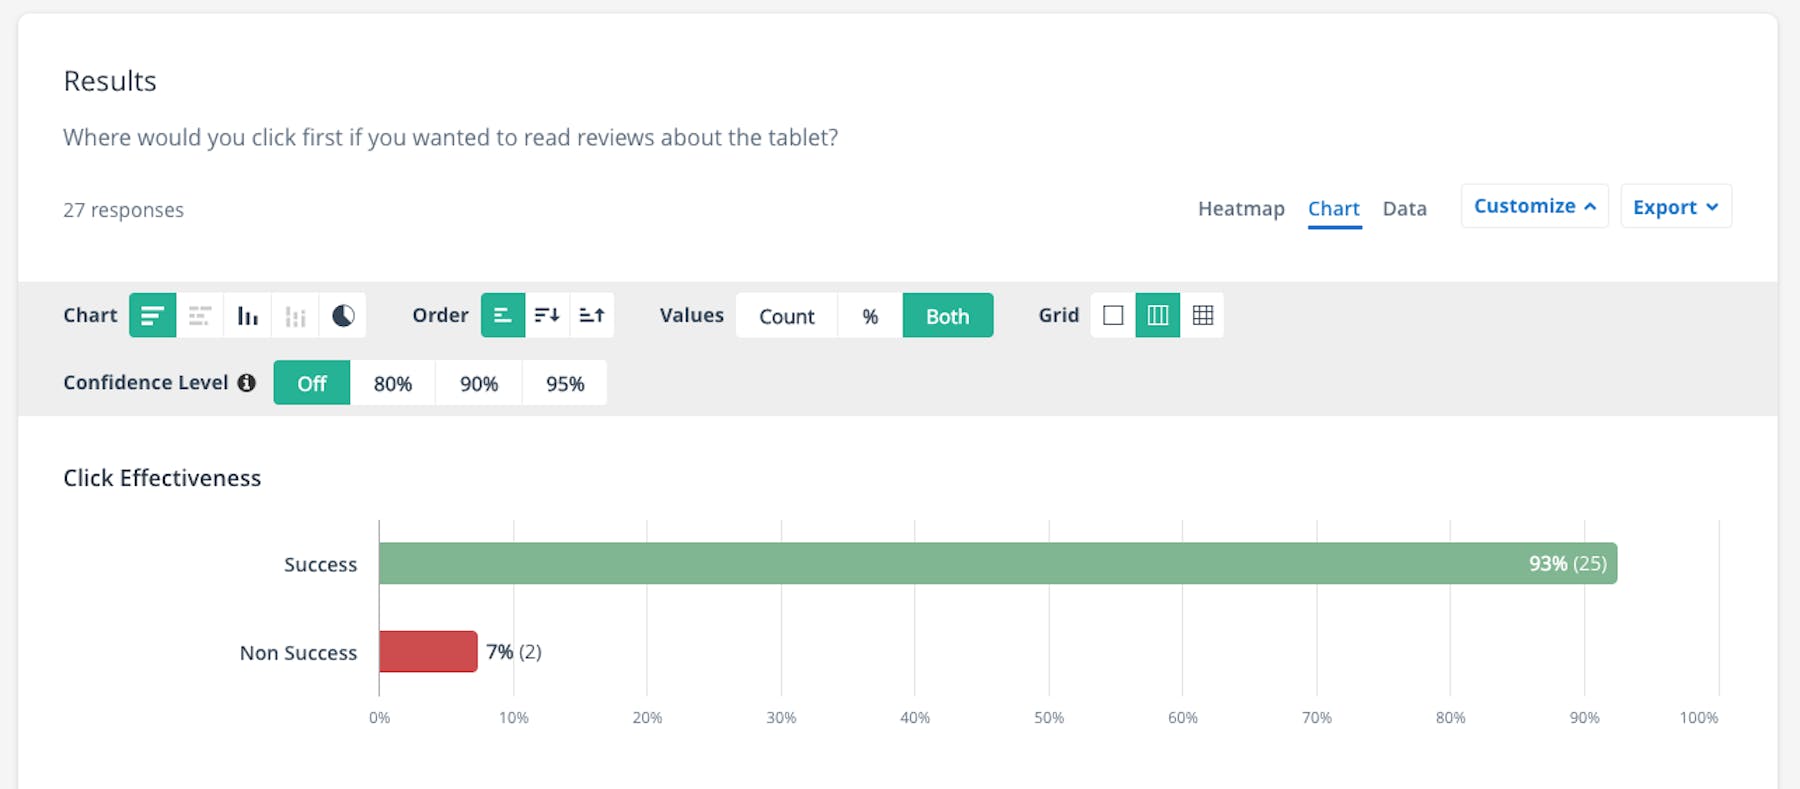
Click tests generate several useful results. By designating specific areas as "success" and "non success", the test can create ‘effectiveness ratios’.
Click tests can also generate heatmaps, darkmaps and clickmaps offering several ways to visually understand where users are focusing. This is useful to quickly communicate results to stakeholders.
Furthermore, user clicks can be broken down into first clicks, first number of clicks, or last clicks to understand where users are clicking over time.
Click Effectiveness
The test results will show the exact number of participants and percentages who clicked on a success area and non-success area, which can be shown on a graph or as a pie chart.
Heatmaps
Heatmaps are an immediate visual clue to how users have interacted with your webpage. It’s an aggregated report that visually displays what parts of a page are looked at, clicked on, focused on and interacted with by your online visitors by displaying more heat with each click.
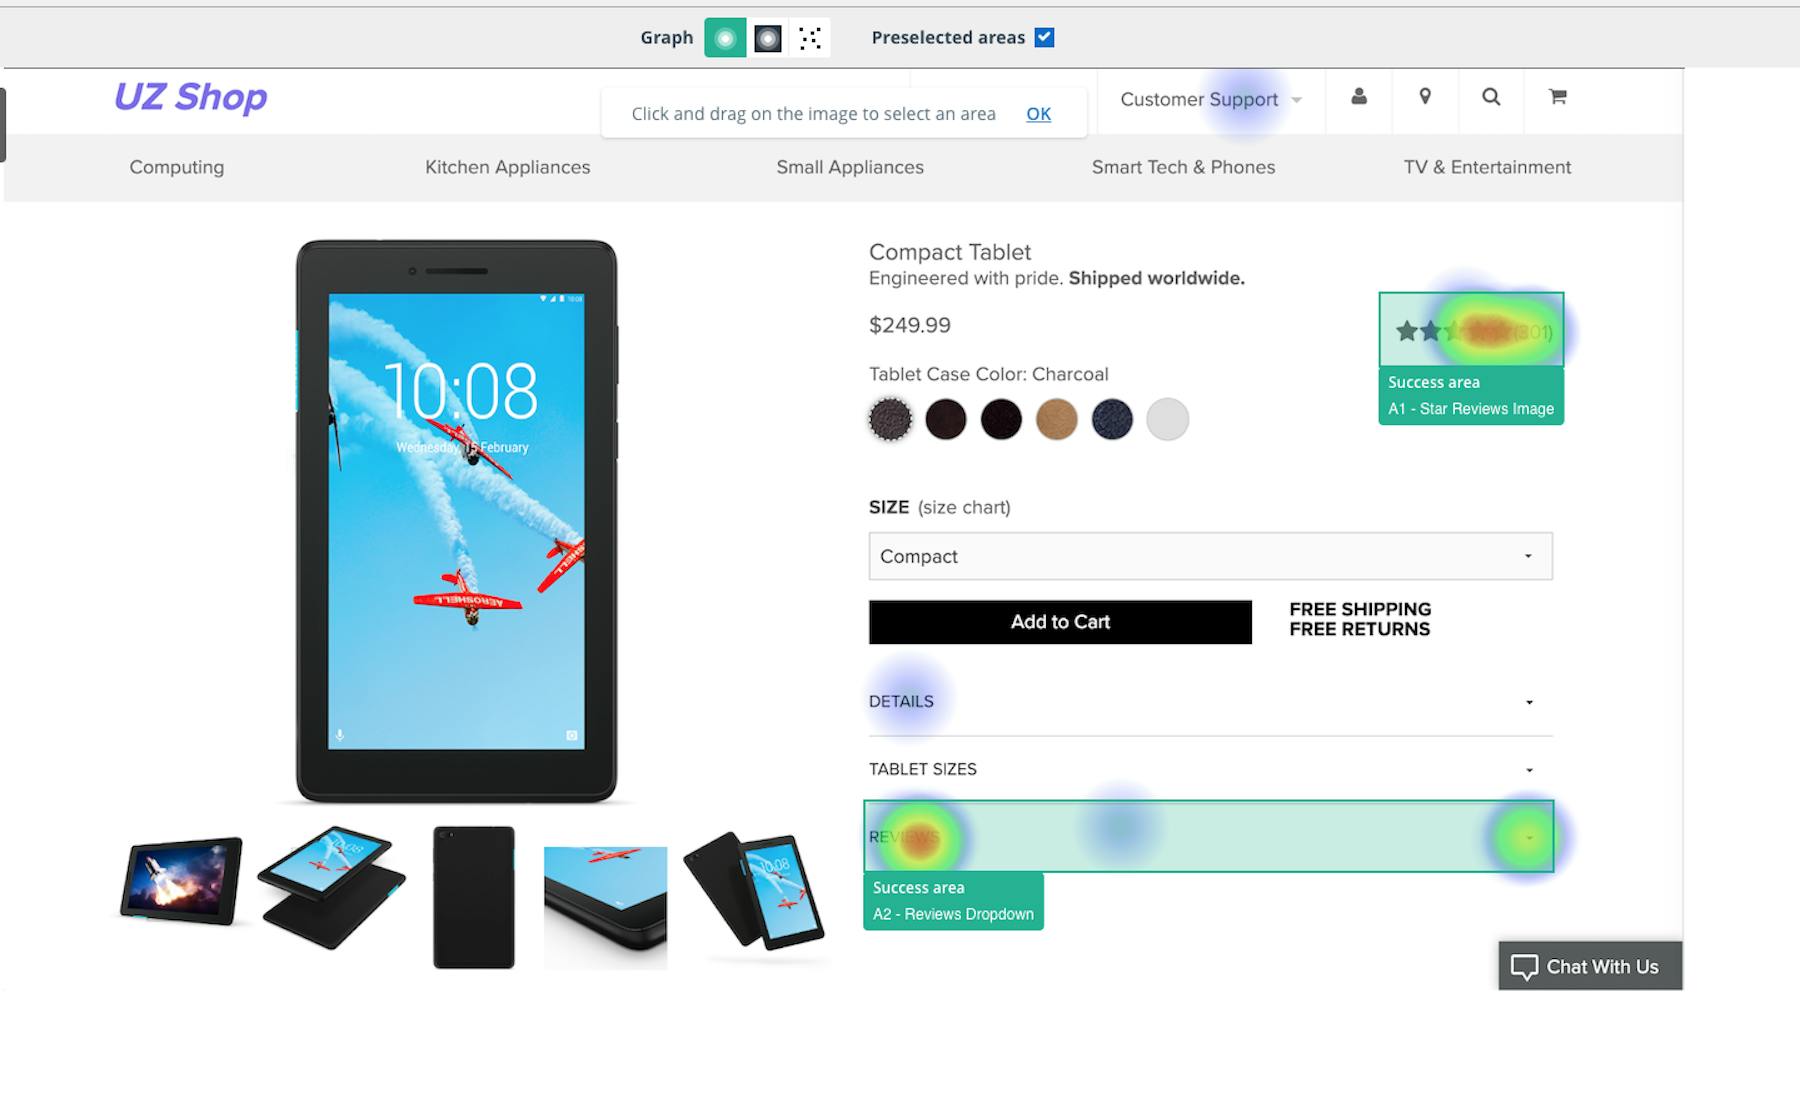
Darkmaps
Darkmaps are heatmaps that darken the page and show more light coming through depending on where users are clicking, This can make it easier to visualize areas that users focus on.
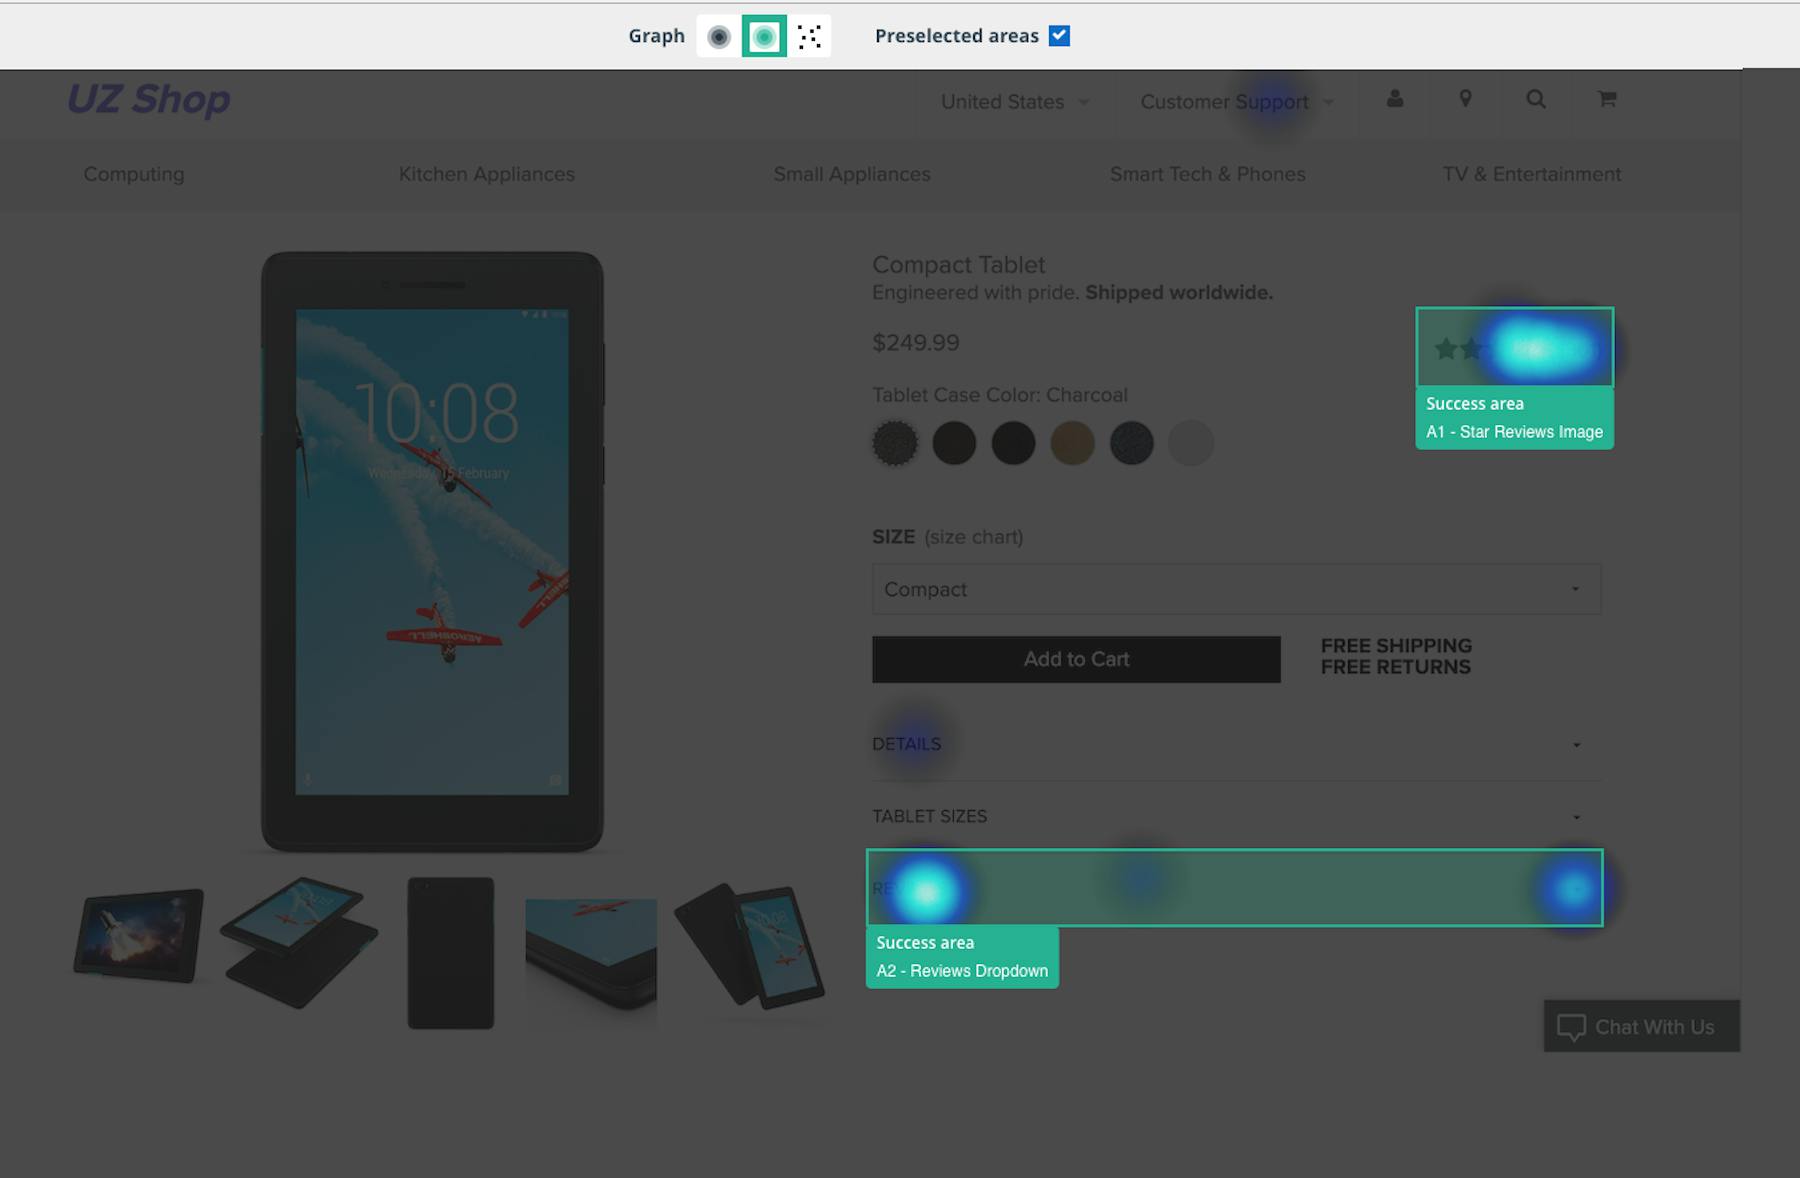
Clickmaps
Clickmaps can be produced from the aggregated results of all participants. These are visualizations that show you exactly where each individual clicked.

Get started with experience research
Everything you need to know to effectively plan, conduct, and analyze remote experience research.
