QXscore™
Measure the impact of customer experience
QXscore is one consolidated metric digital leaders use to measure and track the quality of customer experience across any touchpoint

What is QXscore?
QXscore, short for Quality Experience Score, is a metric developed by UserTesting that empowers digital leaders to measure the overall quality of a customer’s experience across various organizational touchpoints.
Unlike traditional metrics, QXscore goes beyond quantitative data to incorporate qualitative insights, providing a comprehensive view of customer experience.
Guide
How to increase NPS with human insight
Discover how to improve NPS with human insights. Learn actionable strategies to enhance customer experiences and drive higher Net Promoter Scores with UserTesting.

Quickly identify customer signals
With QXscore, leaders get a single 100-point score, weighted across specific metrics that directly reflect how customers engage with an organization's products and experiences. With this high-level scorecard, leaders can quickly understand and act on what's working and what's not with their overall customer experience.

How QXscore works
Real customers and prospects engage with an organization's digital properties, performing tasks like product discovery, messaging comprehension, conversion tasks, and more.
Customers and prospects provide feedback on their experiences, highlighting pain points, areas of satisfaction, and overall impressions.
Data and feedback are analyzed to produce a QXscore, which quantifies the quality of the experience on a scale from 0 to 100, considering factors like ease of use, satisfaction, and success rates.
Customer story
American Airlines improves experience scores 15%
Through its experience measurement program, American Airlines provides QXscores to all its product owners. This gives the teams a common, quantifiable metric to track success over time. The teams share the related data sets and provide a common set of measures to senior executives to justify their decisions.

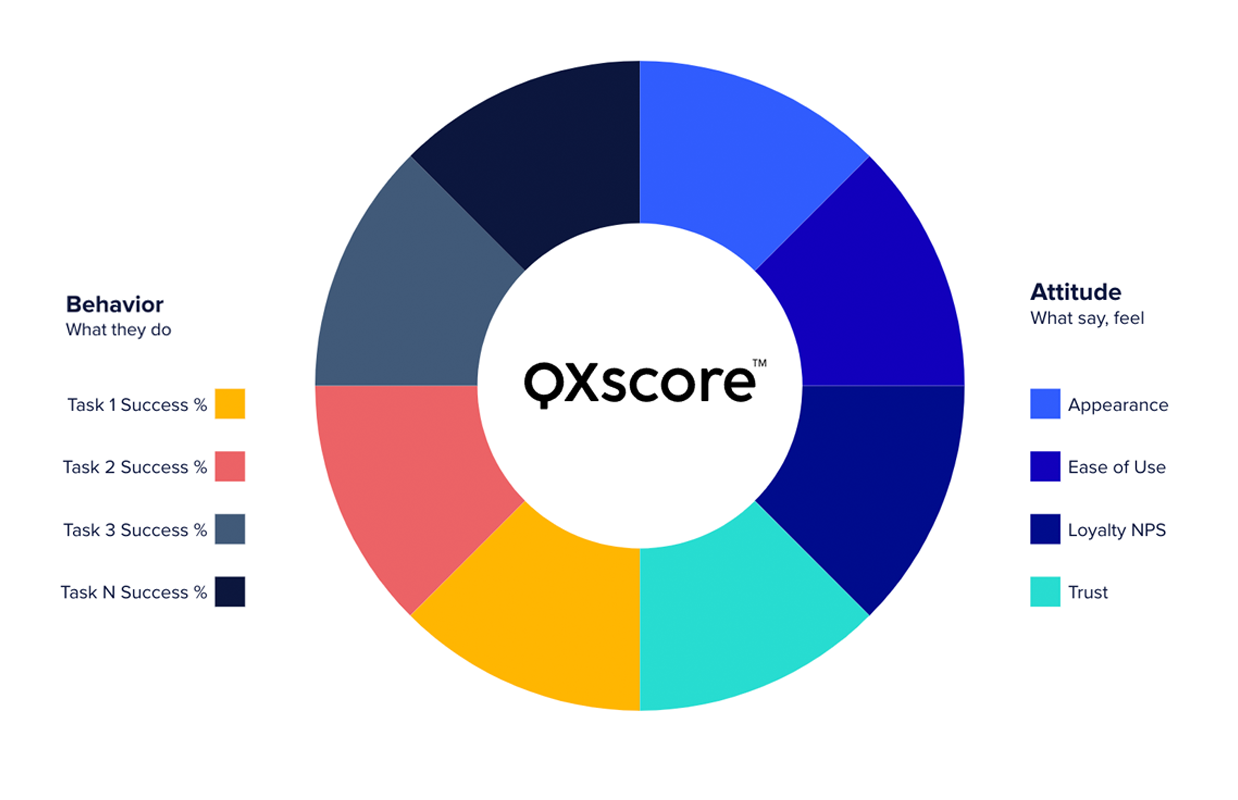
Multiple metrics in a single experience score
QXscore is a standard score that combines these attitudinal and behavioral metrics to provide a complete measure of the digital experience.
How QXscore drives business results
QXscore provides specific, actionable insights into what aspects of the customer experience are working well and what needs improvement.
Organizations can benchmark their QXscore against industry standards and competitors to understand their market position and identify opportunities for differentiation.
With industry benchmarks, detailed customer feedback, and a comprehensive score, leaders can make informed investment decisions that lead to better business outcomes.


