What sample size do you really need for UX research?

At some point in your career you may have heard “Testing with five is enough.” You might have also heard someone say, “Eight is not enough.” Market Researchers doing multivariate, A/B testing and analytics say, “Sample sizes of 1,000 or even 50,000 are not enough.”
So, which is it and why? Before looking at the answer(s) let’s look at an analogy.
If we asked you: “What tool do I need” and showed you this picture below, what would your answer be?

Well, without context, there is no answer to the question.
With that in mind, let’s look at three main categories and use cases that are common in the UX world to help us discern what sample size is typically needed for each:
- Looking for Usability Issues
- Key Performance Indicators
- Comparing two or more designs
Looking for usability issues
If your objective is to identify big issues (a.k.a. big rocks, lower hanging fruits) a sample size of 5 may enough. But if you want to go beyond that, and there is a business value to fixing and optimizing several workflows, go with larger sample sizes.

Small Rocks (Low probability of occurrence) vs Big Rocks (High chance of occurrence)
A sample size of 5 is enough if you are looking for big rocks since they are easier to spot. A sample size of 20 is not enough if you are looking for big rocks and several smaller rocks.
The higher the sample size the more issues you will find. In many cases, especially where design has matured and lots of optimization is needed (ecommerce, B2C websites, e.g.), its recommended to test with larger sample sizes of 20, 30 or even more per segment.
Key performance indicators
Big decisions have bigger implications. That means the person making that decision wants to be confident that they are making the right decision. That’s why everyone reading this article has met at least one business executive, one engineer, or one marketer who would “intuitively” question smaller sample size.
We might be doing a disservice to the better UX cause by stating “3 out of 8 users liked this” or “4 out of 6 users preferred this design.” “Like” is not an observed behavior, it’s an attitude. Preference can be subjective and vary by several segment attributes.
That’s where “confidence level” and “confidence interval” comes in. Simply put, CL (Confidence Level) is the amount of uncertainty you can tolerate. Confidence Interval or Margins is the amount of error that you can tolerate. Lower margins of error requires a larger sample.
Anyone making a big decision would want at least 90% Confidence Level and be able to measure things at +- 10% margins.

The higher the sample size the smaller the margin of error (at the same Confidence Level)
Comparing design options
Comparing two or more design options usually includes comparing those designs on behavioral attributes like Success Rates, Time and/or attitudes like preference, on brand or subjective ratings.
We are trying to detect a difference and claim that Design Option A or Design Option B is better on a certain attribute or multiple attributes.
Without a clear hypothesis of what winning means, it’s hard to know who the winner is.
Sample size depends on the amount of difference you're trying to detect. The smaller the difference you’re trying to detect, the larger the sample size needs to be to determine the winner. If the two options are very different (for participants), the chances of detecting significant difference is higher at even smaller sample sizes. But in most cases the differences are not dramatically different, hence the need for a larger sample size.
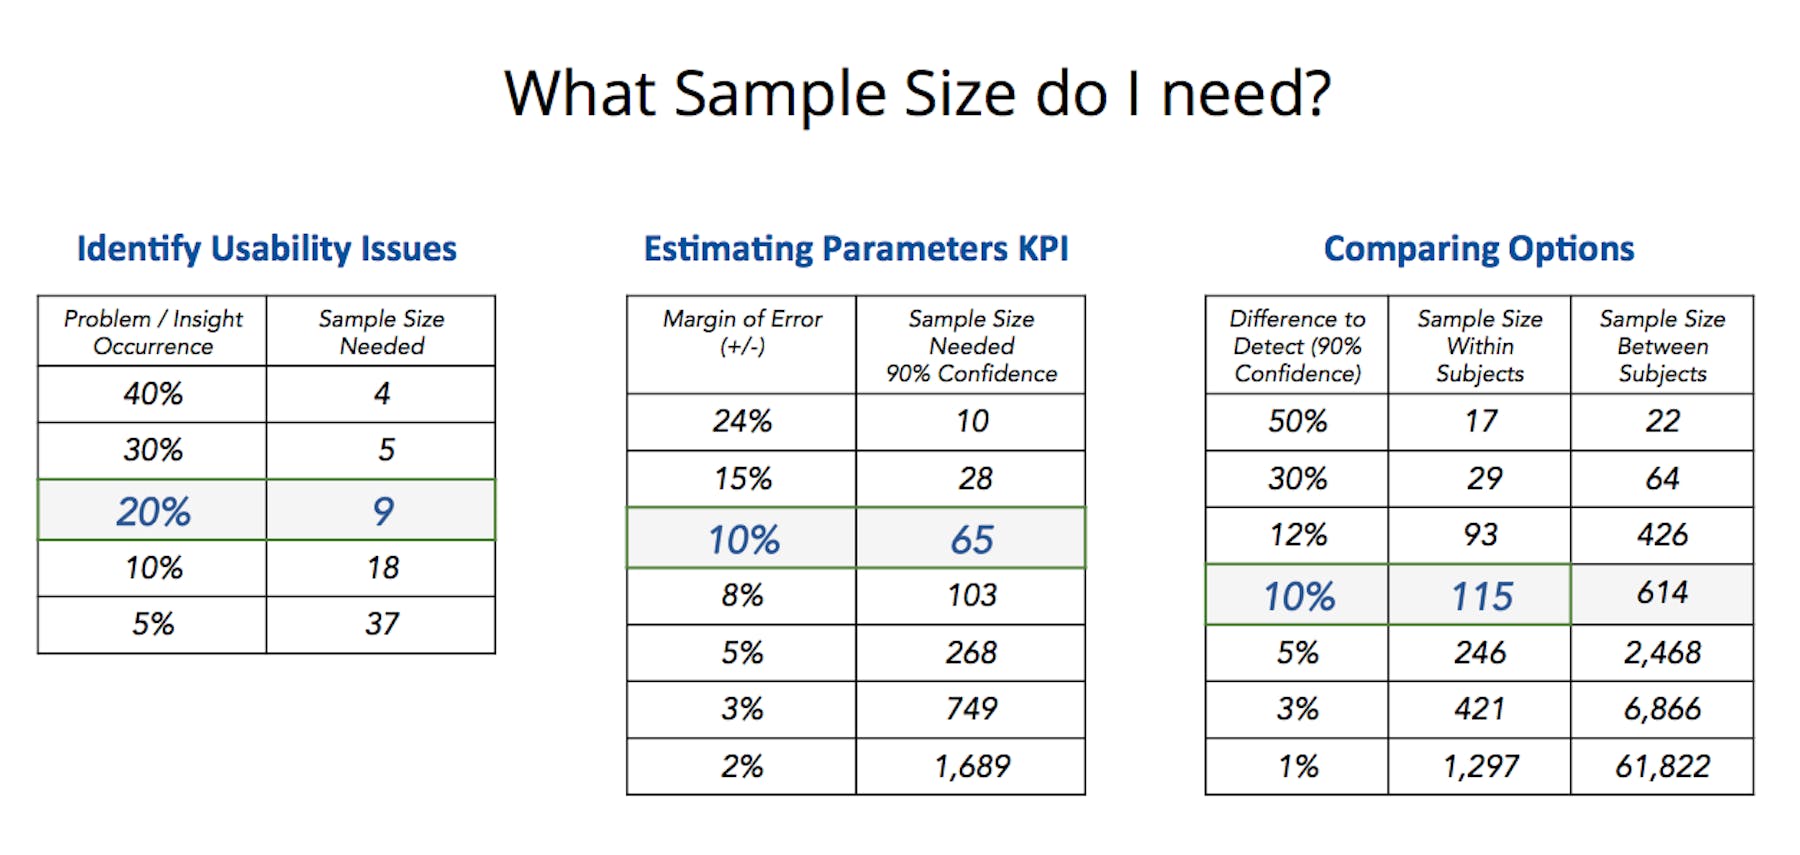
As an example below, a sample size of 115 at 90% confidence can detect a 10% significant difference. But if you want to detect 3% difference, a sample size of 421 or higher would be needed (at 90% confidence level).

Also, sample size depends on the experimental design: Within Subject or Between Subject. Within Subject essentially means that each participant sees both design A and Design B, in a counterbalanced order of seeing A and B. Between subject means that one group of participants see or use design A and another set of participants see or use Design B. To account for any group differences, between subject needs a higher sample size.
Most UX research we see use Within Subject experiments because it allows for a more apples-to-apples comparison of both A and B with an explicit question at the end (preference) and comparison of both options. The added benefit is smaller sample size. Within subject also helps with ideas to combine A and B into a new option C which has benefits of both A and B.
Sample size recommendations
Depending on your intended outcomes, here are our recommendations about sample size. The bold and blue rows are the most common set of numbers we see across hundreds and hundreds of studies.


Watch a demo
See how easy it is to get fast feedback on a website, prototype, design, or more in this demo.


