
Secrets of digital excellence revealed: insider insights from the top 25 US retailers
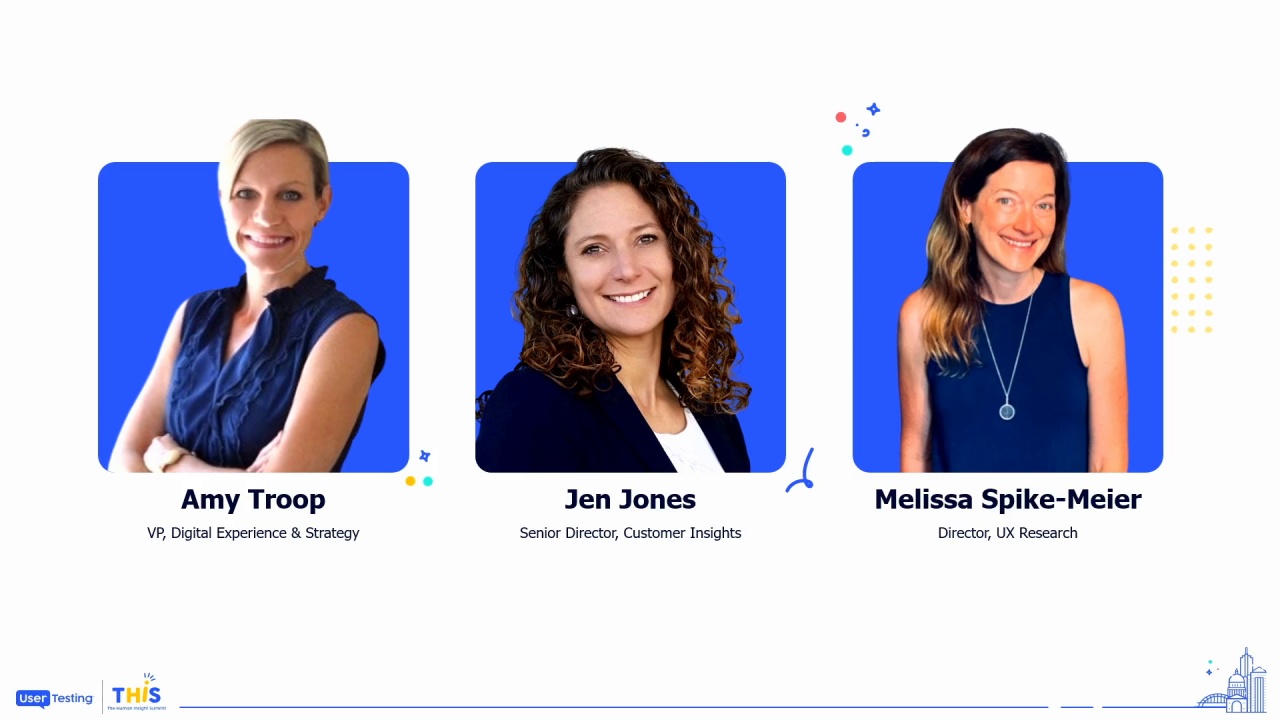
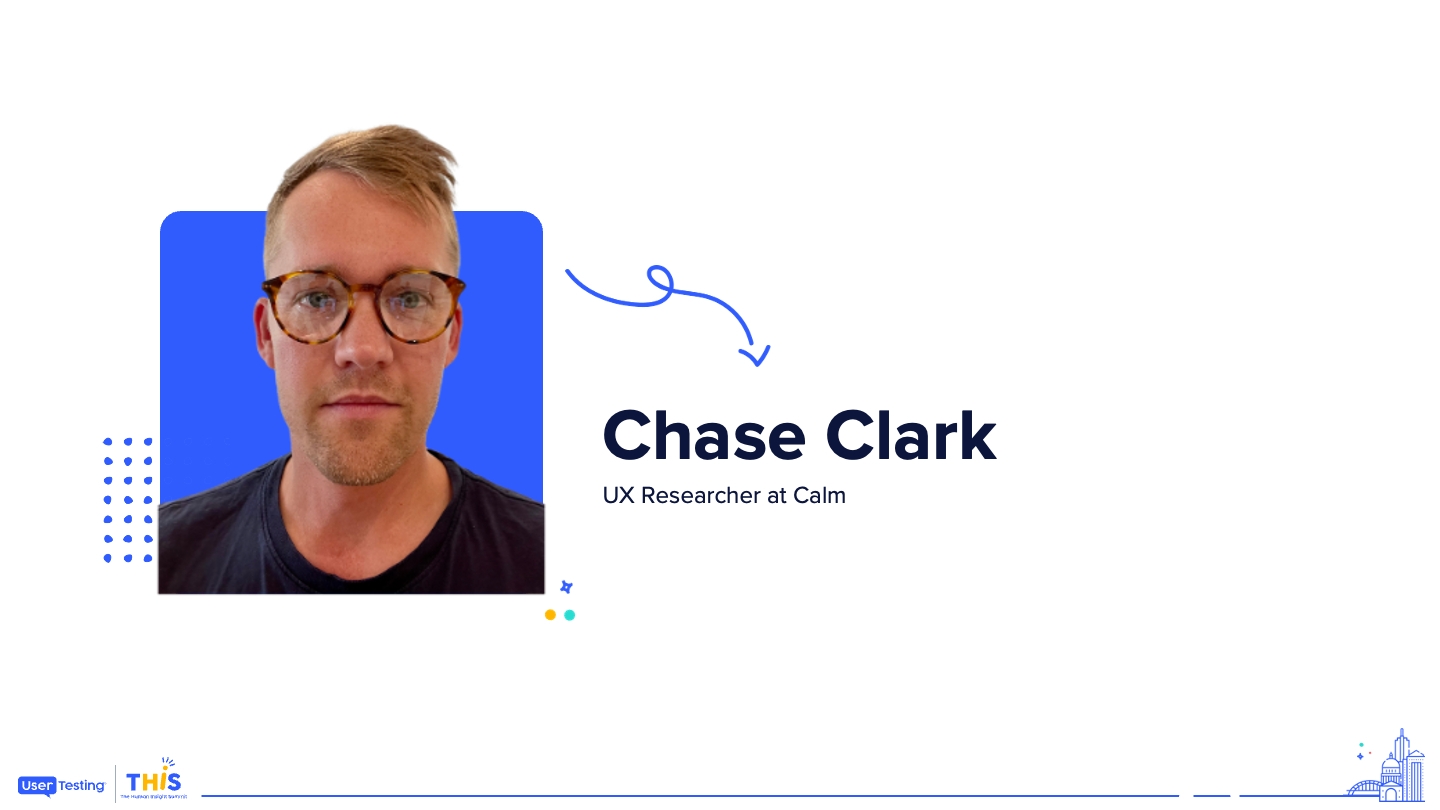
Bobby Meixner
Senior Director - Industry Solutions Marketing, UserTesting
Using the detailed findings of consumer-driven experiences with the top 25 US retailers, this session uncovers the blindspots in your retail strategy: what customers really think about their digital interactions, how retailers stack up against each other, and the secret strategies of top performers. Specifically, we will examine the key drivers of customer engagement and how to leverage these insights to enhance your digital strategy and outperform your competitors.
Course of digital excellence revealed.
And, I wanna take a moment to introduce our next speaker, Bobby Meichner.
He is the senior director of industry solutions and my boss. So be a really good audience. Okay?
This is really important.
And so I I I so I have tons of fun facts. Are you ready? Hold on to your seats here. Okay.
So fun fact, Bobby really loves Barry's boot camp. That's what we have in common.
He also loves playing pickleball.
He lives in LA, but check this out. He grew up...
Course of digital excellence revealed.
And, I wanna take a moment to introduce our next speaker, Bobby Meichner.
He is the senior director of industry solutions and my boss. So be a really good audience. Okay?
This is really important.
And so I I I so I have tons of fun facts. Are you ready? Hold on to your seats here. Okay.
So fun fact, Bobby really loves Barry's boot camp. That's what we have in common.
He also loves playing pickleball.
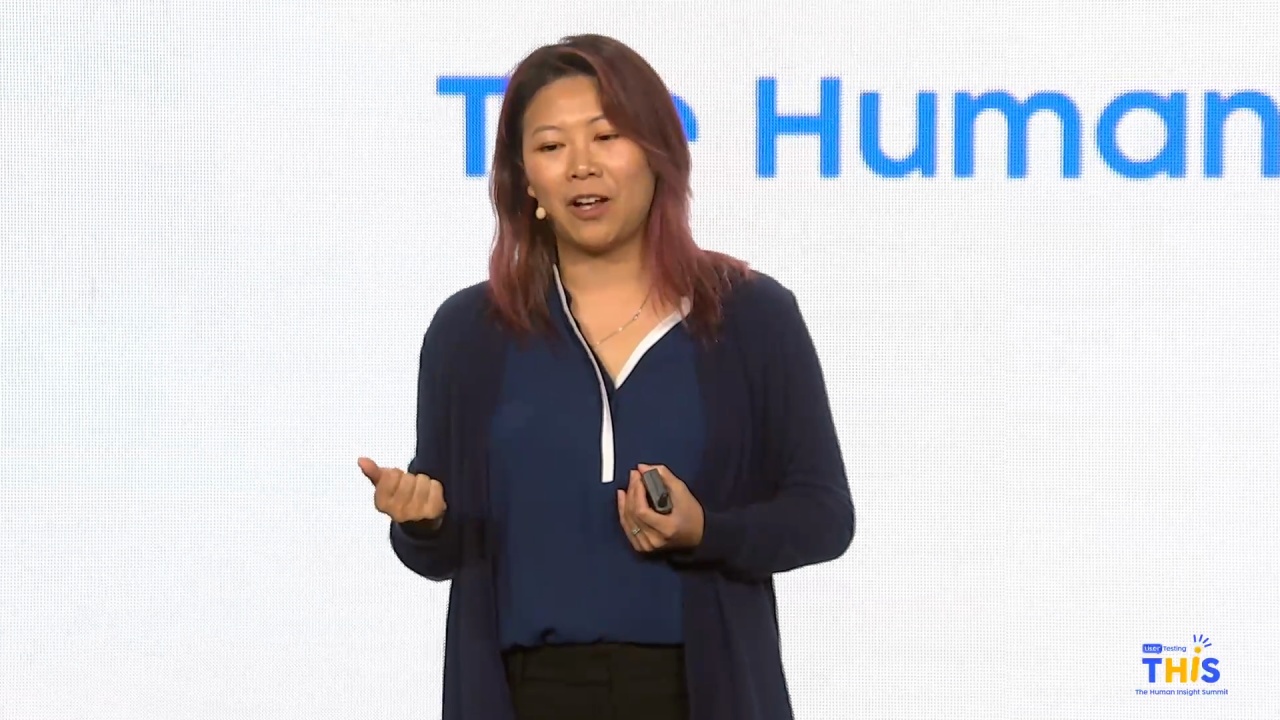
He lives in LA, but check this out. He grew up on a dairy farm. So please help me give a very warm welcome to Bobby.
And for a second there, I thought this was gonna turn into a roast. So we could maybe we do that later. That's part of the after party.
Okay. Got it. Alright. Hello, everyone. Thank you for coming. So this is the last breakout.
I feel fortunate to have your attention. I know it's been a long week. Given that it's the last breakout, I'm gonna throw it back, actually, to yesterday.
Think back, main stage keynote. What did Johan talk about? Right? He mentioned the experience economy.
And the experience economy, right, is this notion that the customer experience that organizations provide, in many ways, is actually more important than the product or service that they deliver to their customers.
And we all have these examples, right? So think about, do we have Spotify people here, or do we have Apple Music people here? Not to get divisive right off the bat.
Okay. Spotify. So you know what I'm talking about then. You're listening to Spotify.
The perfect song comes on. And it's not just about the algorithm. Right? It's the fact that you're listening to a perfect song that makes you feel really, really good.
You're singing and dancing, whether you're in front of the bathroom mirror or cruising down the highway. That's a great feeling. Right? That is a memorable experience.
Or maybe it's a trip to the Apple Store. Right? You've got a problem. You're at the Genius Bar.
And in this case, what is it not about? It's not just about customer support. It's about the fact that you have the ability to sit down and talk to somebody who is able to quickly identify and resolve your problem and do that with real ease. And that is a great experience.
Going a step further, maybe it's Disney. Do we have any theme park people here? I'm not really a Disney person myself, but what do they do really, really well? It's not just about the theme park. Right? It is the all encompassing experience, from the thrill of the rides to the friendly staff and everything in between.
So these types of experiences, they can be really really hard to measure, but the truth is the best companies, the best brands, the best retailers in this case, find a way to consistently deliver an experience that really goes beyond the transaction, right, and creates this all encompassing, measurable experience that produces loyalty.
So today, what we thought we would do is take a look at the digital experience quality of the top twenty five US retailers in Secrets of Digital Excellence Revealed. So let's get into it.
Now, when we're all after building those exceptional experiences, right? We're all competing in the experience economy. And where does it start? It starts with really understanding your customers. And you're all here because you know that, and you're using the best platform in the industry to really understand what your customers truly think about your experiences and why. And we've been helping folks do this for many years.
So we thought it would be interesting to take a look at the publicly available experiences that the top twenty five US retailers are providing. This is the list curated by NRF. It comes out each year. It's based upon revenue.
So what did we do? Let's take a look at some of the details of the study before we get into the key findings.
We asked shoppers to go through and complete four main tasks. Go out and search for a product that you would normally buy on this site, go out and find a gift. In this case, in many cases it happened to be a Mother's Day gift. We ran this research earlier this year in May.
We also wanted to make sure that we incorporated a bit of an omnichannel component, so we went through and made sure that folks were looking for an item that could be either delivered or picked up as soon as possible.
And then finally, what's a digital experience when it comes to retail if you're not measuring the experience quality and the friction points that are coming up in checkout. So checkout was a major component. And we took a look at all of these tasks across both the desktop experience that they've created as well as the mobile experience, and we did it across nearly three thousand participants. So you can imagine the amount of detail that was gathered through all of those tasks.
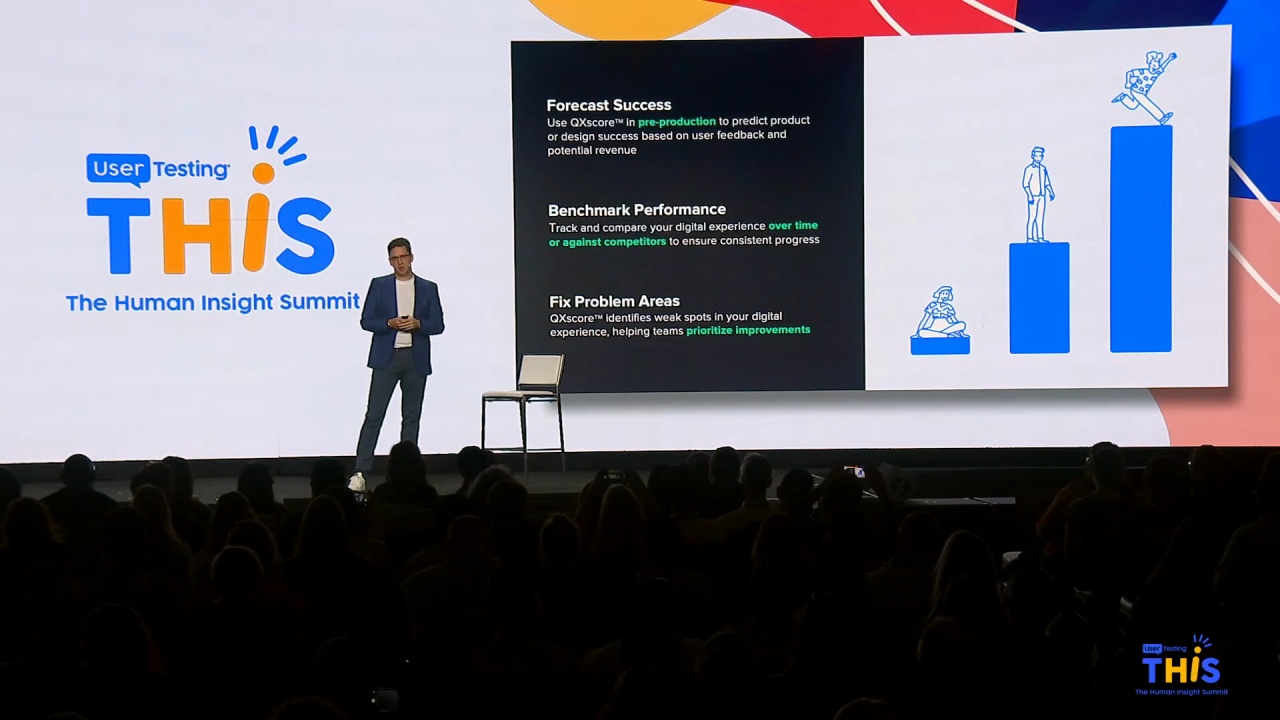
How did we track this? Well, you heard a bit about QX score earlier today, right, in the product keynote. This is something we're really excited to bring to the main user testing platform. If you don't remember, what does QX score stand for?
It stands for the Quality of Experience Score. This is a user testing metric that has really two main components. Right? We take a look at the behavioral side of an experience, so how well, how successful are participants able to accomplish a given task.
And we talked about the tasks earlier. So that's fifty percent of the one hundred point score.
Now the other half of that is more attitudinal. Right? This is the stuff that can be a little bit harder to measure. How did the experience look?
Was it easy to use? Is it an experience that is fostering loyalty and one that you trust? So all of those points combined together into a single score that organizations can use to measure the quality of their digital experiences over time and the digital experiences of their competitors for that matter. And you can see what amounts to a good score, a great score, and so on in the scale down below.
So, let's get into the details. What did we uncover? Let's take a look at what is happening. Well, there's plenty of good news.
So number one, right, is that the years of work that retailers have been putting into optimizing their digital experiences it's bearing fruit. It's paying off. There were high scores all around. There really were no losers in this battle.
Right? So the top performers were really led by the superstores.
These are the big stores, the big retailers that, frankly, should be delivering the best experiences. They have the biggest budget. They have huge market share. So we saw Amazon, Target, and Walmart all leading the way there with scores well into the nineties as we can see on the scale.
Now some of the bottom performers, AutoZone, Tractor Supply, Gap. I personally was a bit surprised to see Gap down there given their longevity in the space and the fact that, you know, they sell apparel, which tends to be one of the more seamless, easier shopping experiences. But we'll drill into what brought their score down a bit. But, again, all scores were really high.
Right? We're dealing with folks that scored in the good to great range. Nobody received lower than an eighty one, and, everyone should be proud of the work that they're doing.
So if we drill into some of the top performers, let's take a look at some of the specific scores.
One of the things that jumped out here is there's not a huge delta between the desktop experience and the mobile experience, and that's a change that we've seen over the years. It used to be you'd go on mobile and it was like, what's happening here? What's you know, it was almost like a game where you had to zoom in and figure out it was like a contest if you could get through an experience or not. That's no longer the case, right? Because more and more transactions are beginning and ending on mobile.
I know that I've bought countless things off of a targeted Instagram ad and, you know, that's where shopping happens. So it's good to see these numbers so high. So what's driving these numbers? If we take a look at some of the specifics that came out in the qualitative feedback.
Number one, we saw a near perfect task success rate and ease of use ratings, again across mobile and desktop, so we kind of touched on that one. But what does that really mean? So, that brings us to number two here, around Search. So, you've got to provide a good Search experience, right? It comes down to the basics. So making sure that search results are relevant, that they're accurate, that folks are really able to intuitively filter using terms that they're familiar with and how they view the shopping experience.
Navigation is really no different. Right? People need to be able to orient themselves on the site really, really quickly so that they can find what they're looking for and get on with their day. And then finally, Checkout is frictionless. People are able to move through without creating accounts if they don't want to. They have the ability to make sure that pricing is clear, delivery options are clear.
There's no mystery there. So that's what we're seeing across the top performers.
But even though but even across the entire set of data here, we saw really, really high scores. Right? The vast majority of shoppers were able to go through and complete their journey. So that can tell us a couple things.
Right? Number one, shoppers are well trained to shop. Right? They they know how to go out and get what they need to get.
But this also I think represents an opportunity for retailers around differentiation.
If everyone's experience is commoditized, then what are we left with? Right? So that kind of goes back to inserting some of those memorable moments into the journey to not only make them frictionless, but make them something that they desire to go back to more and more. One of the things that also stood out is the flip side of checkout, right?
Yeah, the completion numbers were in the 90s, but over six percent of folks were actually unable to check out, which can be a bit alarming. Right? So you might be asking, well why is that happening? What's going on here?
That's where you can drill into the Think Out Loud feedback and some of the qualitative insights that are available in the platform. So let's take a look at AutoZone here. AutoZone was one where users were struggling with checkout, and we have a quick clip, I think it's about, forty five seconds of what's happening on the AutoZone site. Let's take a look.
Well, I clicked checkout, and it just reloaded the page and didn't do anything.
Let's try this again.
Okay.
Didn't do anything again.
It's just reloading the page.
Within points to load.
So I'm still waiting for the, the checkout process to load. It's kind of taking a while.
Voila.
Well, I clicked checkout, and it So that's the end of the video.
But who has customers that patient? I was kinda surprised at the level of patience that some of these folks had. Now granted, they're taking a test, but those are the types of things, right, that can be easily uncoverable by running a quick test. And these folks were really just a sample, right, of the overall data that came back in the study. In fact, forty one percent of folks encountered some sort of obstacle or friction along the way. So let's drill into that a bit deeper. That brings us really to our second finding, and that's really the fact that, you know, it's almost obvious that experiences impact or that obstacles impact experience quality.
But the major consequence here is that it's affecting their likelihood to return and make a purchase. It's affecting their likelihood to become loyal customers.
So when we look at some of the scores plotted out here, here we can see that retailers that have the highest QX scores are introducing the fewest number of obstacles.
So the top performers, Amazon, Walmart, Target, definitely not putting a lot of friction in the customer journey. AutoZone, TJ Maxx, Gap, Tractor Supply are are down there introducing a few more obstacles. But if you look at the numbers, we're not talking about a lot of obstacles. Right? I mean, these are still pretty great experiences.
So you might think that it doesn't have much of an impact, but when you look at the data further on the information that we collected around the likelihood to return, retailers with the highest QX scores are more likely to attract repeat customers. So it's very easy to relate the QX score metric with other metrics that are very, very important to driving a healthy retail business. If you look at some of the top performers, their likelihood to return was over ninety percent. The underperformers was twenty percent less than that.
And even a small number of obstacles can make an impact. Right? So folks that ran into two or more obstacles were thirty four percent less likely to return to a site. So that adds up to real dollars and cents to a retailer's bottom line. And we all know that re engaging an existing customer is much easier than attracting a new one.
So, talking about obstacles, what are we dealing with here? What types of obstacles did folks run into? Well, we saw an example from AutoZone, but what were some of the other common obstacles?
How frequent were things like the site didn't load properly, or search wasn't helpful, it was difficult to filter results?
These are items that I was surprised to see coming up as a recurring theme, because this is really what digital teams consider the basics. Right? And you have to get the basics right in order to be successful, number one, but certainly have a loyal thriving business.
So site loading issues, not being able to find and filter things is definitely impacting loyalty scores. And we see that represented on the scorecards that are automatically generated by the platform. So here's an example. I know it's a little small on the screen, but let's take a look at Gap for example.
Gap was impacted by poor searching. There were a lot of promotional pop ups, cluttered experiences, showing up throughout the journey. And that led they actually had the lowest likelihood to return across all retailers. So when we look at the data here, the behavioral components of QX Score is what's represented at the top.
Right? So Task one around buying an item, the gift. Task three is around going through and doing the omnichannel component for delivery or pickup ASAP. So they've got great scores there.
But when we get into more of the attitudinal elements, the areas that are a bit harder to measure, and folks responded to the questions down below, Notice here on mobile, under loyalty, how likely is it that you would recommend this website to a friend or colleague? Only thirty four percent.
How likely are you to return to this website in the future? Sixty two percent. So if I'm on this team and I'm looking at this scorecard, and we're measuring these results, and we're getting we might be doing this on a biweekly basis or a monthly basis, I wanna then drill into these areas and take a look at some of the qualitative feedback. So let's take a look at the example of Gap here with this video around searching and filtering.
I see a lot of denim ones. So, maybe I will try the filter.
Fabric material.
Let's see if they have oh, they don't have a fleece choice.
Although cotton blend is probably fleece.
So I'll try collection, vintage soft.
Category.
That doesn't help me.
Oh, okay. So fabric material, I'll just go with cotton blend because it's probably gonna include fleece.
And let's see what I got. We got soft bomber jacket and bomber jacket.
I don't think that's fleece.
Alright. So I'll try another way. This is is actually being more difficult than I thought it would be.
Let's search for a woman's fleece jacket medium. Let's see what comes up.
We're gonna hear more from him in a moment, but you can you can clearly see there's a disconnect. Right? Gap isn't really speaking their customer's language. They were not meeting the the female shopper where she was and using terms in their filtering that that that come naturally to her.
Let's go to the next one.
We'll pick up with our gentleman.
If you're saying, how come you're advertising your card to me on four different spots on the site? That seems pushy.
There's a hundred and forty four items, and I get a pop up, saying you're treating me to twenty percent off. No. Thank you.
Search results for shorts. Now it's showing women's and men's.
And get twenty percent off just appeared in my on my screen. This is a very busy screen.
I do not like it. I'm feeling frustrated already.
Very busy. I'm getting frustrated.
Seems pushy. Nobody ever wants to be nothing ever wants to be described as seems pushy, right? That's just not a good thing. So again, going back, this is the type of qualitative feedback that becomes really really valuable, in understanding the nuances of how these experiences are perceived.
So the other piece in this was related to some of the pop ups. So we asked folks about Sponsored Content, and this was an area that caused a lot of frustration, and we wanted to call it out in this context because retailers have really become somewhat in some ways addicted to the retail media business. Right? It's very high margin. We see sponsored content all over.
But, if it's not done in the right way, it can really detract from the experience.
And whether it's truly sponsored content from a third party, or in the case of Gap it's sponsored content in terms of pop ups around their credit card or other promotional offers. It all becomes noise. Right? So being able to identify this, test your way into a strategy that allows you to still take advantage of the benefits of retail media, while not cluttering or frustrating customers.
Alright, number four. This is the last one. So we started to see early signs of a generational shift, right? So we wanted to also collect some other data around shopper preferences as part of this. So here are some key areas to watch out for, particularly among Millennials and Gen Z as their buying power increases. And we saw things really in four different categories.
The first was related to payments.
So, twenty one percent of Gen Z participants indicated that Apple Pay was their preferred method of payment, and that was far higher than any other generational cohort, which we found interesting.
Video was another big one. Right? So definitely very important, highly influential for Millennials.
They want to look at product videos in order to make a purchase. That was much higher than any other cohort.
Social, fifty percent of Millennials use content from social media or influencers to make a purchasing decision, much more, again, than any other cohort. And then finally around fulfillment, this one stood out as particularly interesting because obviously so much focus has been put on optimizing omnichannel and focusing on speed of delivery.
That didn't actually matter so much for Gen Z participants. Twenty four percent of Gen Z participants indicated in store pickup as their preferred method, and that was much less than any other cohort.
So all in all, right, these are the types of insights that are really important to collect when you're trying to stand out in the experience economy. So what do you do? What are you left with? How do you take this and start to uncover your own blind spots? Right?
We've been helping customers across a number of industries do this for years, and it really starts by identifying your focus. Right? Break it down into manageable pieces. And you can really start asking three fairly basic questions.
So let's take a look at what does your analytical data point to? Is there a particular place where folks are dropping off? Right? Is there a problem space or an opportunity where you can leverage user testing to start understanding the why behind the what that you're seeing in the data?
The second is take a look at specific customer journeys that are going to give you the most bang for your buck. Right? Nobody wants to be working on things that are not impactful. So let's tackle those customer journeys that are really designed to increase conversion, increase re engagement, drive loyalty, the ones that are going to make everybody shine, to senior management.
And then three, within those journeys, what are the tasks, what are the micro transactions that make up the end to end journey? Because it really is all about the details, and it's the details that matter.
How do you get started? Right? You answer those questions, but is going to be at a slightly different stage of maturity.
And that's why we like to work with you as a partner. We're not just providing you technology to go out and do research. We're providing you with best practices and methodologies and expertise to augment your teams, make you more successful in the long term. So we have an entire maturity model that is designed to help you identify where you are in your research maturity, your customer feedback maturity.
And that, of course, is all designed to help you identify where you are and where you're going so you can make the most impact. So you can build exceptional experiences, you can grow revenue, you can increase your market share, ultimately reducing costs, reducing risk, reducing rework. Right? We talked a lot about being proactive in making sure that you're measuring the right things and building the right things.
So much work goes into the post production optimization of the experience when you could save a lot of that rework and get to great faster by testing prototypes. We have some organizations that leverage QX score as a stage gate method. So before any design prototype or concept can move forward in development, it may need to have a QX score of eighty five or higher to move forward. So those types of best practices are the things that you can partner with us on, we partner with you on, whether that's through training and support, through User Testing University, our professional services, our network of partners like Zilker Trail, were all designed to help make you successful.
So with that, we have a few minutes for questions.
Yes, please. You have a warm welcome.
Thank you.
Thank you so much.
Thank you.
Okay. Great. Yeah. We just have a few minutes for questions here.
Hello. Hi. Ken's from Tractor Supply. If we were part of this presentation, will that information be available to us when we get the beta slash in January?
So the information is available to you now. We're happy to give that to you. It's also publicly available. You can download the report. But we would love to sit down with you, brief you on additional details that we'd you know, we really just scratched the surface in the presentation, so let's connect after this.
Yeah. Great.
Hi. Thanks so much. Hi. I was curious about the gap example and how the cluttered like, I can see all of the different stakeholders' voices in, like, the clutter, right, of, like, we need to drive credit card sign ups.
We need to drive, like, the total Totally.
Yes. Let's do this and that and that and that.
Something I'm very familiar with and especially knowing that Gap is also trying to get you to shop or browse Athleta, Old Navy. Like, how can you support all of those stakeholder needs? And especially with that multibranded situation, how much did that contribute to some of that clutter?
That's a great question. I think everyone has the moment when they see it. Right? We all saw that and it's like, gosh, it's so obvious to us what's going on there. But when you work in silos that's kind of what you get. So I think going back to leveraging shared insights and being able to, you know, not everyone's doing their own research but giving access to the research that's available to the broader stakeholders and the people that wanna be providing input are ways that you can alleviate some of that upfront.
Yeah. And I think one of the things too that I'm learning more and more about, like, I don't know if you were here for Dell's presentation, but they also use their own benchmarking, but it's very similar to QX four. And one of the things we're finding is that people are getting the most value out of doing this very thing for themselves, like benchmarking against your competitors.
And then when you show your stakeholders that, right, that's the power in this. Because you can click in to some of those videos, you know, you have all of this other data supporting it, But when you start to see it like that and why, then it's it's really then, like, what are we gonna do? That's the conversation.
Yeah. Okay. I saw one over here, and that'll be the last one. Sorry, guys.
We got a few. Okay. An engaged audience. We love that.
Thank you. So some of the retailers you looked at are really big retailers, Amazon, Walmart, Target. They have a wide variety of products. Did you notice any differences in the shopping journeys or, like, how they perform based off of what the product category that people are shopping for? Like, shopping for auto parts is very different than groceries.
Yeah. There definitely was a little bit of difference there where you're on AutoZone and you've got the whole fitment with the vehicle, year, make, model. That certainly complicates things. We tried to abstract that from the research though. So I think I don't I don't remember specifically what product we had folks shopping for on AutoZone, but it was one that was fairly simple so we could try to get a one to one comparison between an AutoZone and a Gap where you're buying a a boot a beanie or a hoodie or something. Yeah.
And and that's also the nice part too because you can just select certain activities.
Right? And so when you're on the site so product still matters. However, when you ask someone to test the search, right, hopefully, then that gives you kind of that kind of clarity that you need to just compare yourself to people trying to do the same kind of jobs. Right?
Wonderful. Well, let's give another warm welcome.
Thank you, everyone. Thank you.
