
In this guide
Calculating and communicating the ROI of product design
Calculating and communicating the ROI of product design
In an era of shrinking budgets and accelerating product demands, product designers are being asked to do more than good design work. As companies strive to innovate and stay competitive, designers are increasingly called upon to justify their contributions in terms of return on investment (ROI). To do that, they must be able to communicate the value of their work within contexts that are often outside their domain of expertise. However, calculating and communicating the value of design presents several challenges—particularly when speaking to executives whose main priorities center on delivery metrics and bottom-line results.
If you’re a designer, you’ve undoubtedly heard that you should learn to “speak the language of the business.” But even though you’ve heard the phrase from countless thought leaders, you may still be unclear on exactly what it means, why it’s important, and—most importantly— how to actually do it.
This guide is designed to help you answer those questions so that you can map out your own process for communicating the ROI of product design within your organization. In it, you’ll learn how to use your design skills to find the right stakeholders, understand their needs, and create a performance narrative that resonates with them.
The challenges of communicating design ROI
Just like any product design challenge, the first step in better communicating the ROI of design is to fully understand the problem. So, before we lay out a framework for communicating design ROI, we have to get very clear on the challenges.
Translation
"It's really easy when it comes to metrics and measurements, KPIs, all of the things that we're being asked to measure on a regular basis, to get a little bit lost, and sometimes even not know where to start in the process. So what do we measure? What's of value? How do we know what to measure? How do we get those numbers? Who do we talk to about them?" – Brian Hoadley, Transformation Consultant
One of the primary hurdles in communicating design ROI is the number and complexity of metrics and measurements across different organizational departments. If not taken into account, this confusion can lead to a disconnect between design teams and the broader business goals of the organization.
This puts designers in a position where they need to translate their work into the language of business. For some, this can be frustrating. After all, most product designers got into the field to express their creativity, improve their ability to problem solve, and create positive user experiences—not move numbers on a spreadsheet.
But like it or not, all team members at any business organization are ultimately there to positively contribute to the bottom line. For today’s product designers, learning to balance the creative aspects of design with the analytical demands of business metrics is a necessary skill.
Tying activities to metrics
Aligning design activities with the company’s strategic objectives isn’t straightforward. To do this, you must understand organizational strategy and map your specific team’s efforts to key business metrics. You have to ensure you’re putting your energy into the things your company cares about most. Specifically, that means identifying metrics the organization values and learning to articulate how design contributes to these metrics.
Overcoming internal resistance
"You need to understand who your stakeholder landscape in the organization looks like. It's going to be really important because those are the people that you're then going to need to rely on in order to find out what things are important to them." – Brian Hoadley, Transformation Consultant
At some organizations, designers also face the challenge of stakeholder engagement and understanding. Many product design teams lack a thorough understanding of different stakeholders’ influence, interests, and attitudes toward design and research.
Engaging with stakeholders effectively can be daunting, especially when trying to influence those who may not immediately see the value of design. But just like with any design project, empathy is the starting point.
Fear of exaggerated impact
"Free yourselves from the burden of being one hundred percent accurate. Take credit for the amazing work and impact that you're having… " Your company has invested in a design, or research, or UX function. They need to know the return on that investment." – Jason Giles, VP Product Design at UserTesting
Although it isn’t often mentioned, another challenge for product designers is knowing when to claim credit for their work. Designers often hesitate to share their achievements, which can undermine their perceived value within the organization.
More often than not, being shy about the impact of design harms organizations more than it helps. While it can be scary to tie product design to business performance at first, it’s better to share the insights you do have around impact than to keep quiet.
A framework for aligning product design with business metrics
Studies have shown that the challenges of communicating design ROI are a widespread phenomenon. Just take a look at a few of the statistics below
- Only 10% of executives consider UX teams “strategic” to their business
- 60% of designers are perceived as artists
- 70% of designers and researchers wish they could prove the value of their work
While those stats may seem disheartening, there’s good news: Product design teams are up to the challenge and already have the skills necessary to ensure their value is fully appreciated across their organizations. Let’s take a look at the steps to get there.
1. Understand organizational priorities
"Look at the strategic pillars of the company and identify the key metrics and measurements associated with them." – Brian Hoadley, Transformation Consultant
The first step in aligning design with business metrics is to develop an understanding of the organization. At the highest level, your organization will most likely have a strategic plan or vision. For design teams, this is a great place to start. Begin by analyzing documents such as V2MOMs, OKRs, executive memos, quarterly reports, and press releases. Earnings calls can be another great resource as they require executives to simplify the business strategy for investors. Your goal is to understand what performance indicators are being highlighted most often so that you can start getting a feel for what’s important.
Most organizations’ business strategies center on a handful of priorities or “pillars” that executives drive or monitor. Each pillar will have a number of metrics and measurements associated with it.

Metrics exist at every level of an organization, from top to bottom. The C-suite has its reports to the board. Product, research, and design teams share their reports with other teams and leadership. Individuals can share their contributions with their respective teams.
Of course, it’s a little more complicated than that. For example, in a product delivery chain, metrics may be shared by multiple teams, such as design, research, and engineering. Each team is contributing something to the pot. This is where designers must do the legwork to trace a straight line from their individual contributions up through their team to the final product. It’s always beneficial to have a clear explanation—on hand—of the part you played in the project.
UserTesting customer Zendesk is a perfect example of how design teams can effectively attach their contributions to top-line executive metrics. From a product perspective, Zendesk teams set out to improve new user onboarding with the goal of driving adoption and renewals. They were successful, with a 300% boost in clicks on the ‘Get Help’ button. But the real story is the effect their optimizations had on annual recurring revenue (ARR): They saw a stunning 12% increase.
For Zendesk’s design team, the boost in clicks alone is an incredible story. However, correlating that behavioral change to ARR—a foundational business metric any executive would care about—gives the story a powerful hook and displays a thorough understanding of the organization’s top priorities.
Below are some additional business metrics your design team could potentially tie efforts to.

2. Conduct stakeholder interviews
"I often come into a company and do my own desk research, looking at strategy documents and listening to earnings calls. Then, I map out who I need to talk to and start having those conversations." – Jason Giles, VP Product Design at UserTesting
With an understanding of organizational strategy in place, the next step is to understand key stakeholders and their individual contributions to that strategy. The best way to accomplish this is to simply seek out the relevant parties and interview them for the information you seek.
In these interviews, ask questions such as:
- What metrics are you accountable for?
- What does success look like for your team?
- What are your riskiest assumptions?
Beyond those core questions, you and your team will know what other information is needed to get the complete picture. The ultimate goal is understanding what stakeholders and their teams are accountable for. What does a win look like for them? This will tell you what kind of information they might be interested in hearing from you.
When the interview is done, it’s always a good idea to cover your bases with questions like: “Is there anything I’m overlooking?” or “Who else do you recommend I talk to?”
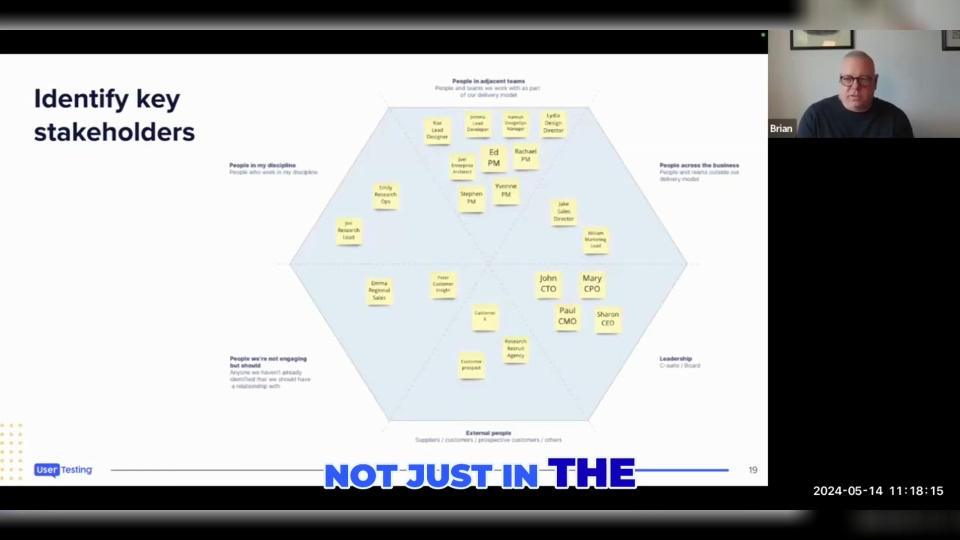
3. Create a stakeholder map
"Doing a mapping exercise with your team and then extending that out can be really key to identifying where pockets of information sit and who needs to know what and who you need to be engaging on that." – Brian Hoadley, Transformation Consultant
Once the initial research and interviews are done, you should create what’s called a stakeholder map. It’s a visual resource covering the stakeholder landscape within your organization. A stakeholder map communicates different stakeholders’ influence, interest, and attitudes toward design and research.

Creating a stakeholder map will help you and your team quickly identify who to share certain metrics with, as well as what metrics those stakeholders track, so that you and your team can present the right data to the right people. There are different ways to group individuals and visually communicate stakeholder information. Some general approaches to stakeholder mapping include:
- Grouping stakeholders by authority
- Grouping stakeholders by discipline
- Grouping stakeholders by influence
- Grouping stakeholders by design naysayers, champions, and evangelists
Visit here to see different stakeholder mapping templates you can use.
Remote video URL
Keep in mind that the influencers at your organization aren’t always who you think they might be. Additionally, there will often be stakeholders who aren’t decision-makers but do need to be informed throughout the process via passive reporting. Identifying those individuals is another essential part of stakeholder mapping.
4. Align design activities and business metrics
With the stakeholder map and insights in hand, the next step is to align the design team’s activities with relevant stakeholder metrics. At this point, you’ve gathered a lot of data about different people in your organization. Now, it’s time to figure out whether the design team’s activities are driving the metrics that are important to different stakeholders. This is a gut-check moment for your team. It’s a time of self-reflection to see where you’re spending your time so you can ensure you’re putting energy into the company’s priorities.
During this period of reflection, you’ll make changes and updates to your stakeholder map—adding new people, removing those that don’t belong, and providing additional context. Next to the name of each stakeholder on your map, you should be able to list the metrics they care most about and are accountable for.
Across stakeholders, it’s good to understand which measures are common and which are unique. This is so that design teams can avoid delivering a “one-size-fits-all” report. While these reports might be easier to prepare, they typically exclude the interests of certain stakeholders or force them to sift through the reporting to find what’s relevant.
Remember, internal communication with stakeholders is just like a design problem. You’ve now identified your audience, what matters to them, and what you want them to do. The next step is prioritizing and trimming your list down to only the most influential individuals. You don’t want a list with dozens of stakeholders. The goal is for you to be able to efficiently tailor reporting to each relevant stakeholder.
As you align your team’s accomplishments with relevant business metrics, you can leverage our KPIs checklist to see how your team can start translating design metrics to business value. Below is a small sample of what this looks like.

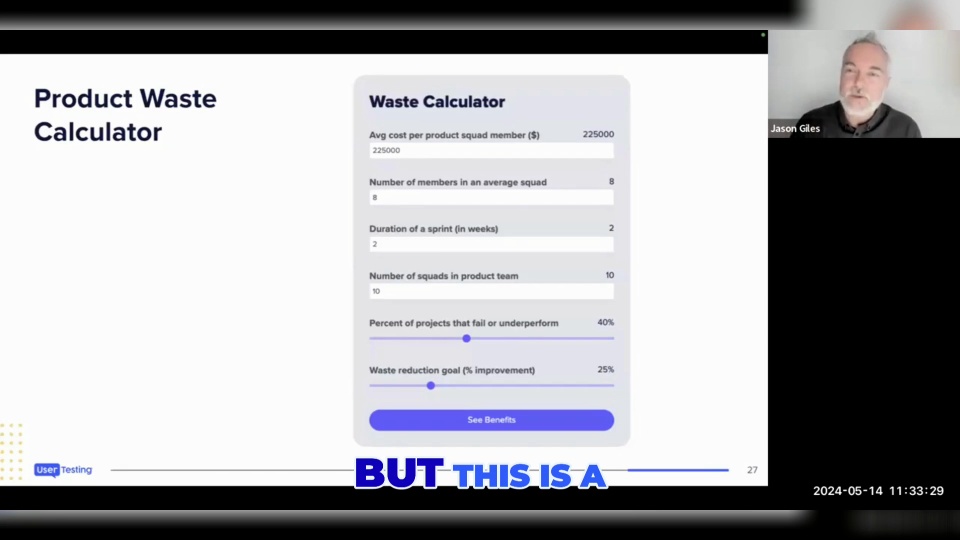
Tying the design team’s work to key business metrics provides another chance to get creative. One overlooked way design teams can measure the effect of their design process is by looking at the money saved—or rework avoided—thanks to their approach.
If your team had gone in a different direction without getting proper customer feedback, how much time would have been wasted? How might the product have suffered? You can dive into these operational questions in a retrospective with your team. Even better, you can plan for this kind of data at the beginning of a project, as we’ll see in an example below.
To add more detail to this aspect of your design team’s performance, leverage tools like a product waste calculator to estimate the actual dollar amount of value your team provided by avoiding product waste.
Remote video URL
Example: Aligning metrics, top to bottom
To put this kind of thinking in context, let’s look at an example showing the different types of metrics design teams can monitor, throughout a project, to tell a powerful story. One of our clients, an organic skincare company, had a key strategic pillar of expanding their “total addressable market.” To do that, they created a new line of tinted products featuring 30 diverse shades for different skin tones.
Their primary product metric for the launch was “increased online sales growth.” Because introducing so many new shades would create an additional risk of increased product exchange, their operational metric was to “reduce product exchange cost.”
To ensure they were heading in the right direction conceptually, the design team focused on the UX metric “strength of solution preference” during initial concept testing. Meanwhile, the product team’s two key metrics were “speed to market” and “reduction in rework costs.”
Once the design concept was validated, the teams began prototype testing. During this phase, the primary metrics tracked were “task completion success,” “time on task,” and “task level satisfaction.”
After launching an alpha version of the experience, the company then benchmarked this new experience’s performance against their existing product line’s experience to see how it compared. The UX metrics tracked in this phase were “usability,” “task success,” and “customer satisfaction.” The teams’ reporting in this phase also incorporated cart conversion and NPS.
Finally, when they fully launched the product, they performed a brand tracker that tracked “awareness,” “consideration,” “preference,” and “action intent.”
By taking the right steps from the beginning to ensure they could communicate their value, the teams were able to claim the following metrics by the end of the project:
- Successfully entered a new product category with a brand lift of 35%
- Increased conversion by 300% compared to the legacy experience
- $1.8m in development cost savings by avoiding rework
- A reduction in product exchange costs by 78%
5. Make it a story
"Craft narratives around your metrics. People relate to stories, not spreadsheets." – Brian Hoadley, Transformation Consultant
Most people have had the experience of presenting their work only to watch an audience’s eyes glaze over. It’s a frustrating feeling. That’s why storytelling plays such a crucial role in demonstrating the value of design. Crafting that story is an important part of a product designer’s role. Taking the time to understand what matters to people and learning to share stories in a format that resonates with them is a skill that can be developed over time.
Before you or your team puts together the report, ask yourselves:
- Who needs to be told? (see stakeholder map)
- What is the narrative?
- Why should they care?
- What do you expect them to do?
- How does this reflect on your team?
- What format and channel best suits the stakeholder?
Beyond the improved performance metrics your team achieved, address how individual users felt about the changes you made. How did the team feel about the work they accomplished? What important lessons could be applied to future projects?
The format of your report is another important element of the story. Get creative with the medium you use for different stakeholders. Most people need more than a spreadsheet to understand a project’s impact. Different stakeholders will have different ways of absorbing information. You could present your results in a deck, document, video, podcast, short story, etc.
Final thoughts
As mentioned throughout this guide, stakeholder mapping and internal communication are just another design process. As a designer, you have the skill set to do these things well. Learn to apply your creativity to solve these internal challenges and try not to get overwhelmed by the task. It’s a process. If you’re new to it, it’s a muscle that can be developed.
Don’t be afraid to take credit for your impact. By aligning your efforts with business metrics and effectively communicating the value of activities, you can secure your team’s place as a strategic leader within your organization.
See how UserTesting maps onto your design process
Check out our complete guide to user-centric product design to see how UserTesting can be used at each stage of the product design process.
Get the latest news on events, research, and product launches
© UserTesting 2025