Product Keynote: Measurable Insights
Lija Hogan
Principal, Customer Experience Consultant, UserTesting
Christopher Schmidt
Global Accounts Director, UserTesting
Discover the latest product innovations from UserTesting in this dynamic session. Learn how our evolving platform empowers organizations to access fast, actionable feedback, accelerate time-to-insight, and measure customer experiences. Join us to see how these advancements are shaping the future of experiences and helping businesses make smarter, customer-driven decisions.
Now to talk more about measuring digital experiences, whether it's over time or against competitors, I'd love to introduce Leah and Chris.
Good to see you all here. Another day.
Kind of the last day. Getting ready to wrap things up. But as we go through our, product keynote today, I get to talk to you about something that I am very, very excited about. So been at this company for almost a decade, and I've worked with hundreds, if not thousands, of companies.
And one of the things that I think I'm most excited for is the QX score...
Now to talk more about measuring digital experiences, whether it's over time or against competitors, I'd love to introduce Leah and Chris.
Good to see you all here. Another day.
Kind of the last day. Getting ready to wrap things up. But as we go through our, product keynote today, I get to talk to you about something that I am very, very excited about. So been at this company for almost a decade, and I've worked with hundreds, if not thousands, of companies.
And one of the things that I think I'm most excited for is the QX score, because I think it is gonna have a massive, massive impact on all of your roles and your companies.
So let me tell you a little bit of the reason why I believe that.
So one of the things that I found, and and we see this all the time with many, many of our customers, is there's kind of three problems that I think every organization experiences.
One is fragmented data.
We see it all the time where your analytics team might be looking at some of that behavioral data. Right? They're looking at what's going on on the website.
Our UX research team and our design team might be looking at the attitudinal data. And so they're out there looking at, you know, how do people feel about the experiences and designs that we're creating?
But a lot of times that's coming from different organizations.
And we've talked a little bit about, you know, never any silos at organizations. So obviously, all that data is all sitting together at once, which we never actually see.
Mhmm.
The other thing that we see all the time is unclear insights. So a lot of the insights and data that we're looking at can be subjective.
There's a lot of voices, a lot of stakeholders, a lot of people kinda looking at, you know, hey, here's the information that we're seeing, but everyone might have a different point of view on that.
And we're all kind of talking in different languages.
For somebody that's not familiar with qualitative research, right, they might be a little bit confused about, you know, hey, you only did this research with ten people. What do you mean that's that's good enough? Right?
And the last thing that we see, and again, almost every organization that we work with, is there are benchmarking inconsistencies.
It can be really, really challenging to look at competitive benchmarks.
We see it all the time where you might have somebody like JD Powers who's saying, hey, you're doing a really great job.
Right? And we're just looking at the widgets and things that you've built into your system.
But we don't actually know if people like that, but we know that our competitors have it, so we should be building it too.
And again, that might be managed and and held by different organizations within your company.
So again, those three areas are are things that we see consistently causing problems.
And the other thing that Johan was talking about yesterday morning is we are still in a position where we are still we're actually seeing a decline in the overall experiences that our customers are feeling. Right? We're seeing this almost everywhere.
And one of the things that we've seen, obviously, in in two thousand eighteen, we started to see a lot more investment in UX and design and creating really amazing experiences.
COVID hit, and organizations started dumping money into UX and design.
But a couple years later, when your CFO gives you a call and he goes, hey, we just gave you everything that we've been asking for for nearly a decade.
What do you have to show for it? It can be really, really challenging to go and show what is the impact that we have made to our products and our experiences and design.
A lot of it is intangible.
And so we started to see a decline in the investment that was made in the experiences, and we see this directly when we ask customers, how do you feel about your overall experiences?
So one of the things that, you know, I again, this is where I think we have a massive, massive opportunity to make an incredible impact on our experiences and our designs.
A lot of organizations, again, that we've worked with over the years, we see that measurement is typically done at the very, very end of the process.
Right? We've all gone through the product development life cycle. We've all seen this process unfold where we get a bunch of, you know, I call them hippos, highest paid person's opinion. Somebody says, hey, we need to go build this.
And we see them, you know, we come in, we build a concept, we kinda create on it, and then they say, hey, design. Go go design this. Right? Go figure this one out. And then they go, okay, well design's just, you know, following their orders, and they're following their instructions because somebody said that we have to build it.
So then once it's done once we're done designing it, then we go send it to the development team and they actually build it, and then we go and launch it.
And up till that point, we have no idea if this design or this product is actually gonna be effective, if it's gonna work. Is it the right thing to even be building?
So what I wanna pose to all of you is a challenge. Can we flip that script?
Can we take that insight and that information that we get once we actually launch a product where it takes a lot of money to make changes at the very end of the process? Can we flip the script? Can we start getting that kind of information, that intelligence, and that data in that early, early phases of design?
Well, I think we can, and I think we can do that with a QX score.
So if you're not familiar with the QX score, this was something that we've been working on for many, many years. We've got hundreds and hundreds of customers that are doing this. We've got a lot of incredible data.
But where it really started was through a couple of, people way, way smarter than I. I think one of them sitting in the room over here.
Really developed something that I think is an amazing, amazing data point.
Again, one of the challenges we're talking about fragmented data.
So one of our customers, about five years ago, they were working on some designs, and they found they were running NPS on those designs. And NPS is obviously kind of an indicator of their attitudes. Right? How do they feel about that experience?
And what we found is they were getting really, really high NPS scores.
But when they were actually looking at the designs, the task success metrics, nobody could actually use it. Nobody liked it. And we found that the attitudinal data that we were looking at was really just an indication of the brand, had nothing to do with the actual designer experience that we were looking at. But we understood, though, through that attitudinal data, how people felt about our experiences and how their brand how their brand was impacting them.
Then we look at the flip side. We look at the behavioral side.
In the behavioral side, we can see if somebody can do something. Right? We can see if it has high usability, but we don't know if it has utility. Is it something that act people actually even want? Is it worth our time to go through and develop and engineer that?
And so one of the things, again, when we talk about that fragmented data, so many organizations, we're only looking at one piece of the piece of the puzzle.
But with the QX score, what we've done is we're able to take the attitudinal data.
Right? We're able to take the behavioral data and combine that into a single score that now becomes a leading indicator for our overall experience that is capturing both, you know, how do people actually feel about it with the attitudinal data, and can they actually do what we want them to do?
If we're only looking at one side, it becomes really, really challenging to understand the full picture. But with the QX score, we can actually now understand the entire picture and understand, does it have usability and does it have utility? Is it something that's even worth building?
So again, we are really, really excited to introduce you to the q x score. Right? Because there's a lot, a lot of application to this.
And so again, when we're taking the attitudinal data, right, we can see that, on the bottom there on those four tasks, and we can see the task success.
And we can actually start to understand, is this something that actually people wanna do? Do they like it? Is it something that they can use?
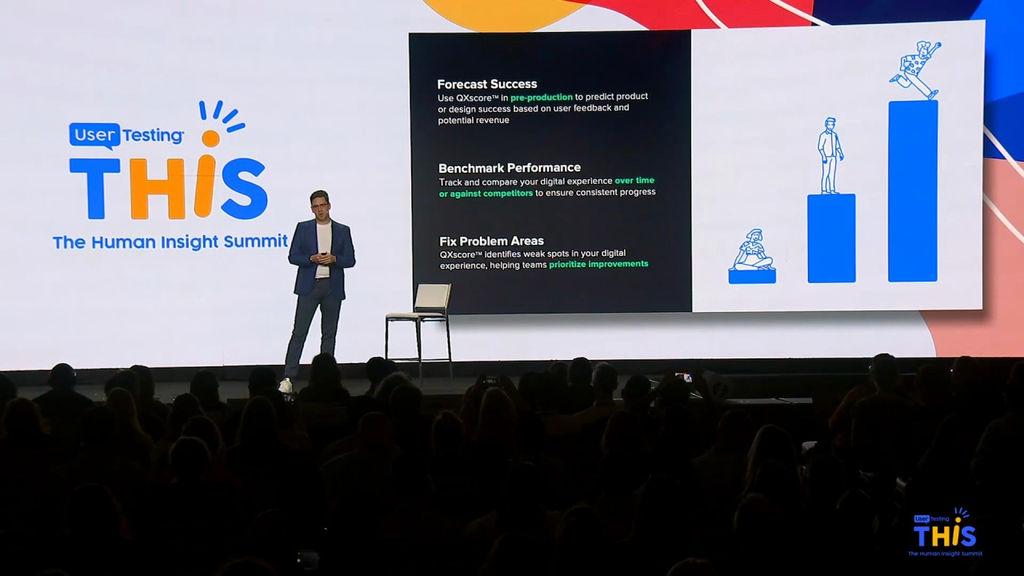
And so when we look at the QX score, one of the again, one of the things that I'm really, really excited about is it's got three amazing, amazing applications.
So the very first application, we kinda look at this on a crawl, walk, run. Right? We're not expecting completely changed your organization.
As with all good things, it takes a little bit patience and time to build this out.
And so the very first spot that we really look at the applications for QX scores in a diagnostic fashion.
So in a minute, Lee is gonna talk about kind of how this whole process will unfold with our friends at care fair travel.
But in the diagnostic phase, what this is really allowing you to do is in a very simple manner, look at the QX score and be able to identify where are our bottlenecks? Where are the areas that task success is really low? What are the parts that people can't actually get through that don't allow them to complete that task or that journey that they're trying to go on? And so now you can start to work as a UX designer or a researcher with your product team. You can really start to understand, you know, these are the challenges. These are the areas that we need to focus on.
The second phase that we start to look at is well, it's great to start to understand, you know, where are the challenges and where are the bottlenecks, but what we're really excited about is its potential as a program.
Right?
So now what we can start to do is we can start to take those QX scores over time, and we can start to show, hey, this is the improvement that we have been able to make on our digital experiences in our in our designs. Right? This is where we start to see a massive massive ability to be able to go in and answer that question of what have you actually done for me in design? How can you prove that you are making better experiences?
And the other part to this is it starts to become it starts to really solve that challenge of rework.
So a number of organizations that we've been building out these programs with have started to implement this in a position where we might say, in the design process, we are not gonna send designs to engineering anymore unless it meets a minimum threshold.
It's gotta be above our baseline on the QX score. Otherwise, what are we doing here on the design team if we're actually gonna send the engineering something that's not gonna be significantly better? And then obviously, engineering gets really frustrated when you start sending designs over to them, and they you start to make changes to it while they're in the middle of developing it. But once we actually implement this as a program, we can see that it's we've had the proof that it is better than the experience we've already been working with today, and we don't have to worry about changing all those all those iterations once it actually gets development.
And the final phase that we really see a lot of value in is when we start to look at the QX score in conjunction with some of your other systems. We've talked a lot about the integrations that that user testing is developing, but I think one of the most exciting parts here is when we can start to look at the QX score as predictive.
When we start to look at AB testing data and we have our QX score on those AB tests, and we can see how QX score is actually impacting our conversion rates, our call center volume.
So that now in that design phase, we don't have to guess anymore. We know that if there's a five point increase in QX score, that it should lead to a three percent reduction in call center volume.
And so when your CFO comes to you and says, hey, as a UX organization, what have you done for us?
You can now definitively tell them we've just saved you thirty million dollars in call center volume, or we just increased conversion rate by seven percent, which leads to another eighty million dollars in bookings.
A massive amount of value.
And so when we look at the QX score, right, we're really trying to solve kind of three main areas. We wanna see you all become a little bit more data driven. We have a metric that now we can start to share throughout the organization.
We can start to be a lot more consistent with the bridge marking using a single score and everyone using the same language, and we see a massive, massive opportunity with its predictive power. So to share a little bit more about the journey, I'm gonna pass it over to Leah Hogan, to come back to our care fair friends and talk a little bit about how this process unfolds.
Alright. So okay. I'll let you clap first. Gotcha. Yay.
So, I hope by the end of my presentation, you're out of your seats and clapping and yelling. Because, as a researcher, I'm really excited about this because the power of QX score is partially that it helps to automate some of the things that take us so much time to do right now. And so by walking through this real life scenario and actually, I was watching the news this morning and, there was a little bit of a different light on it.
I wanna be able to show you, just a little bit under the hood what this looks like and how the QX score can be a programmatic tool, but also something that's very actionable from a design standpoint as well. And so imagine that we've got Sarah, who is a product manager again, but has a team of researchers and designers who have really been tasked with increasing or actually decreasing the percentage of calls that come into the call center that are about rebooking future, well, existing travel reservations.
And so how many of us flew here? A lot?
Okay. Yeah. A lot of us. Did any of you have to rebook your flight?
I see. Yeah. Couple of hands there. Was it easy? Yeah. I see head shaking. It's not easy.
And it's not easy for a variety of reasons. I think one is sometimes very much about the experience itself. Sometimes it's about the payment options. It can be about a lot of different things, but you're not gonna know until you dig deeper into the problem.
So let's say that they've got a goal to, really like, right now, the calls that are coming at about thirty percent, and we all know that call center calls are expensive, so we wanna deflect people to that online channel. And they wanna reduce this to only five percent and then also deliver a great experience.
So with her team, they leverage what I like to call kind of like a quant quant quant strategy. So over time, what you're doing is looking at quantitative data from a performance standpoint on your operational experiences. It could be digital. It could be service, whatever. Right? And then you can use a quantitative strategy around the attitudinal piece as well. So that really is what were people's intents, like, as they came to visit the site today and whether or not they were successful.
And you complement that information with empathic data. And this is where the QX score comes into play.
And so they run an a test, a usability test, using QX score on the live experience.
What happens?
So essentially, what they're able to do is launch a test to a very large pool of participants that have a variety of goals and needs and expectations, but then also have the common goal of, needing to rebook an existing reservation in the situation where there's been a cancellation.
This changes a little bit nowadays.
So they launched this test, And, what the QX score enables you to do is really focus on, again, the behavioral separately from the, like, attitudinal information here. I think I was yelling too much last night at the bar. So, hopefully, some of you guys heard me well last night, and I can carry through.
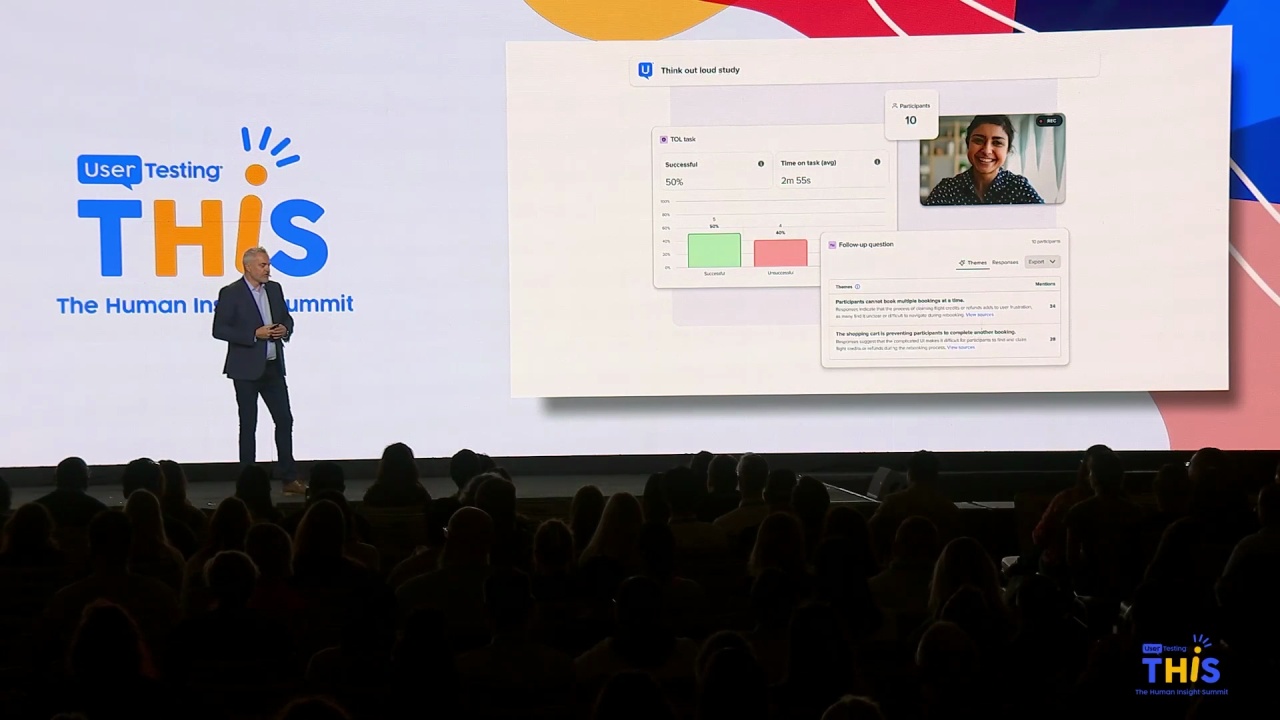
So, I think one of the important things to think about is core usability is first around task, success, and time on task. You get that data with the QX score. And you get that for each one of the tasks.
And you get a sense for whether or not there are specific areas where there are barriers in your experience. Right? That all boils up into that overall score. But this is where it's really helpful for design teams.
Then you pair that with this, like, well, what did you think?
And while this particular test shows that people fall find that call to action to book a new flight quickly, the problem really is there's a lot of uncertainty around how to manage refunds or compensation in this situation.
So what happens?
I think there are a couple of things to really think about. One is the super queue, I guess, model is used to understand the experience. So that underlying those those constructs of appearance and loyalty, ease of use, usability are things that you can really get a sense for for that overall experience.
And when you go, hopefully, to spend some time at our product demo booth, you'll get to see that you can add on additional questions on a per task basis to dig a little bit more deeply into what were your perceptions, not only of this entire experience, that's what SuperQ is really about, but also, like, those individual tasks, if that's interesting.
So when Sarah's team looks at the data, a couple things become clear. Like, look. The QX score is not awesome.
Not awesome. And usually, we find that in those situations, it's usually one area of the experience that really is dragging down that overall score.
And in this case, they're finding that only about sixty five percent of people are successful. So two out of three, that's not awesome.
It could be better. But, specifically, select payment method is an issue.
And sometimes that's something that's really hard to pick up on. Like a missing control is difficult to pick up on because you don't have analytics around it. So the best way to surface that is using a usability test.
So Sarah's team, using design best practice of iterative testing and redesign, decides to use the QX score test to run, some tests against Figma prototypes. So, again, you can test during all across the product development life cycle.
And you'll notice that there are only four payment methods here, and none of them directly say, here's how you spend your refund, Right? Or if you've got travel credit.
So what they do is essentially add a control.
And essentially, what they're able to do is really understand what's the was is. How is that impacting the experience?
And as you can see, adding that makes it super clear what you're supposed to do and how you're supposed to apply those travel credits. And, again, being able to use the QX score to get an understanding of how does it perform now and how does it perform with that improvement is really helpful.
So they launch with, the improved.
Or they take that information back to the team.
And they can launch and then see that improvement in analytics. But they can also see that the QX score predicts that change in analytics. They have confidence because they've used data to make the decision to make those improvements to the experience.
So what is really powerful that's also coming in tandem with this automation is the fact that to tie this story altogether, instead of having to generate separate reports over time, you'll be able to create a a report that pulls together that data for you over time so that you can see that movement in the QX score and get a sense for when did we see these improvements happen in terms of performance and how does that relate to some of the product launches that we've been doing informed by research? So it helps you to really surface the connection between your work and what's happening in your digital experiences.
So I think, really, to just sum up again the story that we're both telling this more this morning, Chris and I, it's important to understand that the QX score and benchmarking in general is a really powerful way of both understanding what you are where you are right now, helping both your team and executives understand where you can prioritize improvements to the experience, and also tracking improvements over time. So there's a real strategic as well as tactical value to doing quantitative user research.
